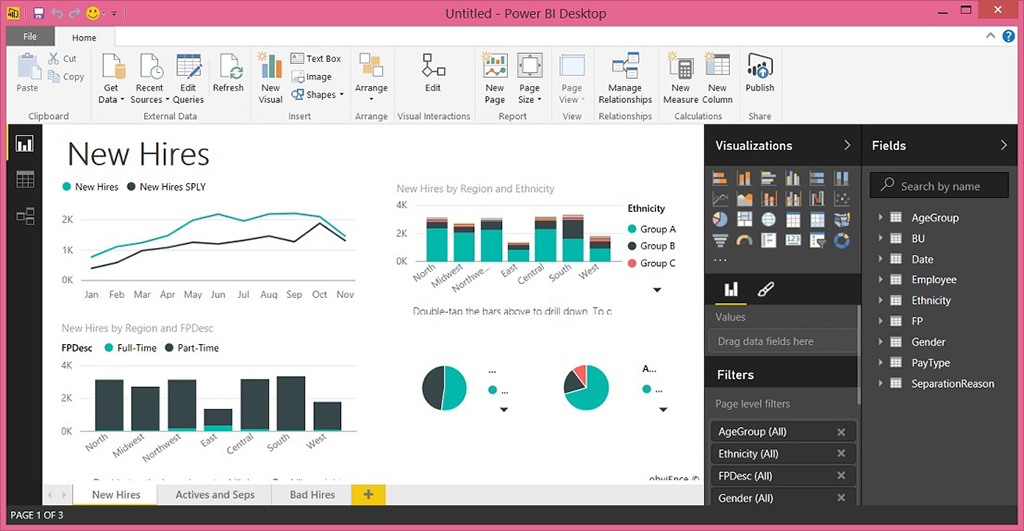
What is Power BI?
Microsoft Power BI is a visualization & Business Intelligence solution that helps you create stunning reports & dashboards.
Companies need to make the right business decisions. Power BI can help you do that. In order to make decisions, we need business data. These data can come from multiple data sources: Excel files, SQL Server database, CSV-files, …
Or maybe you are using unstructured data like images, or videos. Data can come from all types of places. The whole idea behind Power BI is that you can connect to that data no matter which data type you are using.
These are the different components of Power BI:
- Power BI Desktop
You can download Power BI desktop for free. Just simply go to the Power BI website and start using Power BI. Have a look at what Power BI desktop can do for you in terms of working with data.
- Power BI Service
This is a cloud service in the Microsoft cloud offerings. The main focus of the service is to enable sharing and collaboration. You can share dashboards and reports either inside the organization or outside the organization.
- Power BI Mobile App

Analyze reports and dashboards by using your phone, tablet or other smart devices.
- Power BI Pro
This version allows you to access all content and capabilities in the Power BI service. This includes the ability to share & collaborate content with other Power BI Pro users. With the Power BI Pro license you can publish & consume content from workspaces, share dashboards and subscribe to dashboards and reports.
- Power BI Premium
 This version is meant for large enterprises and enables you to work on even larger data sets, unlimited number of users and also offers additional features inside the service.
- Power BI Embedded
 With Power BI Embedded, independent software vendors and developers can quickly embed visuals, reports and dashboards into an application or portal for external users, even for non-Power BI users.
- Power BI Report Server

The Power BI Report Server gives you access to interactive reports and reporting capabilities of SQL Server Reporting Services within the enterprise.
Power BI is one of the market-leading reporting and dashboarding tools. It is characterized by its ease-of-use, self-service-BI capabilities, and attractive price-offering.
Contact us for more information on Power BI and on how to get started in your organization.
History of Power BI
Over the years, Microsoft released a couple of very powerful Excel add-ins in order to facilitate self-service Business Intelligence in Excel:
- Power Pivot, an in-memory column-based data modelling tool (which served as the starting point for Analysis Services Tabular and column-store indexes)
- Power Query, an easy-to-use and very powerful self-service data wrangling tool for ETL-like transformations
- Power View, an intuitive and interactive dashboard tool
- Power Map, a tool to map data onto a 3D globe. At a later point, custom maps were introduced as well.
They all started out as Excel add-ins, but over the years they (except for Power Map) have become integral part of Excel itself. In order to share your results, Microsoft introduced in 2014 Power BI for Office 365. Excel was considered as the starting point of your self-service analysis, using the mentioned add-ins. By uploading your workbook to Office 365, your colleagues were able to view your dashboards and reports in their browser.
However, Microsoft quickly changed strategy and replaced the Power BI for Office 365 environment with a separate cloud environment: the Power BI service.
Furthermore, Microsoft also introduced Power BI Desktop: a free stand-alone development environment where you can develop your queries, data model and interactive reports. Power BI Desktop is basically the combination of Power Query, Power Pivot and an updated version of Power View. There are however some capabilities that set Power BI Desktop apart from its Excel siblings:
- Custom visualizations. There's a whole gallery of open-source visualizations for you to download and use in Power BI Desktop, and you can build your own if needed.
- Python and R integration. Both are powerful statistical languages, popular by academics and data scientists. You can use it in your queries to mash-up data (or do even profiling, cleansing or predictions) or use it to create advanced data visualizations.
When the analysis is done in Power BI Desktop, you can publish your Power BI Desktop report to the Power BI service. There you can create interactive dashboards on top of your reports. You can share these with other people even outside your organization and build row-level security on top of it. The Power BI service also supports alerts where you get notified if the data goes over a threshold.
Example Power BI dashboard (left) and Power BI Report builder (right)
Everything published to the service is also available in the native Power BI Mobile App, which is available for Microsoft Surface and devices running iOS or Android.
The Power BI service offers the capability to connect directly to on-premise data through a gateway, or to refresh the uploaded data to the cloud.
Another great feature are the content packs: pre-defined queries, data models and dashboards on top of several cloud providers.
It is for example possible to create a fully functional dashboard on top of your Google Analytics data in just a few clicks.
What makes Power BI so powerful is that it comes at a really low cost, but also that it is updated very frequently: new features and capabilities are added each month.
Contact us for more information on Power BI.
