Introduction
In this insight, we will explain to you what visual calculations are, what they are able to do, how you can use them and when they come in handy. Furthermore, we will give our opinion on the feature as it is right now. Ready to deep-dive into the world of visual calculations?
Visual Calculations
Before, Power BI had 4 different types of calculations; calculated columns, custom columns, calculated tables and measures. In March '24, Power BI introduced (in public preview) a fifth type; visual calculations. A visual calculation is a DAX calculation that is defined and executed directly on a visual. Visual calculations make it easier to create calculations that were previously hard to create, leading to simpler DAX and better performance. Visual calculations have an Excel grid-like interface but still require some basic coding in DAX. In the picture below, you can find an example of the creation of a visual calculation in the Power BI Desktop.

Using Visual Calculations
We will show you how visual calculations work, by giving an example. We start from a part of the adventure works dataset.
The star schema looks as follows:

You can use many existing DAX functions in visual calculations. Functions specific to visual calculations are also available. Since visual calculations work within the confines of the visual matrix, functions that rely on model relationships such as USERELATIONSHIP, RELATED or RELATEDTABLE can't be used. Indeed, when using visual calculations, we can state that we have a new filter context; the filter context of a visual.
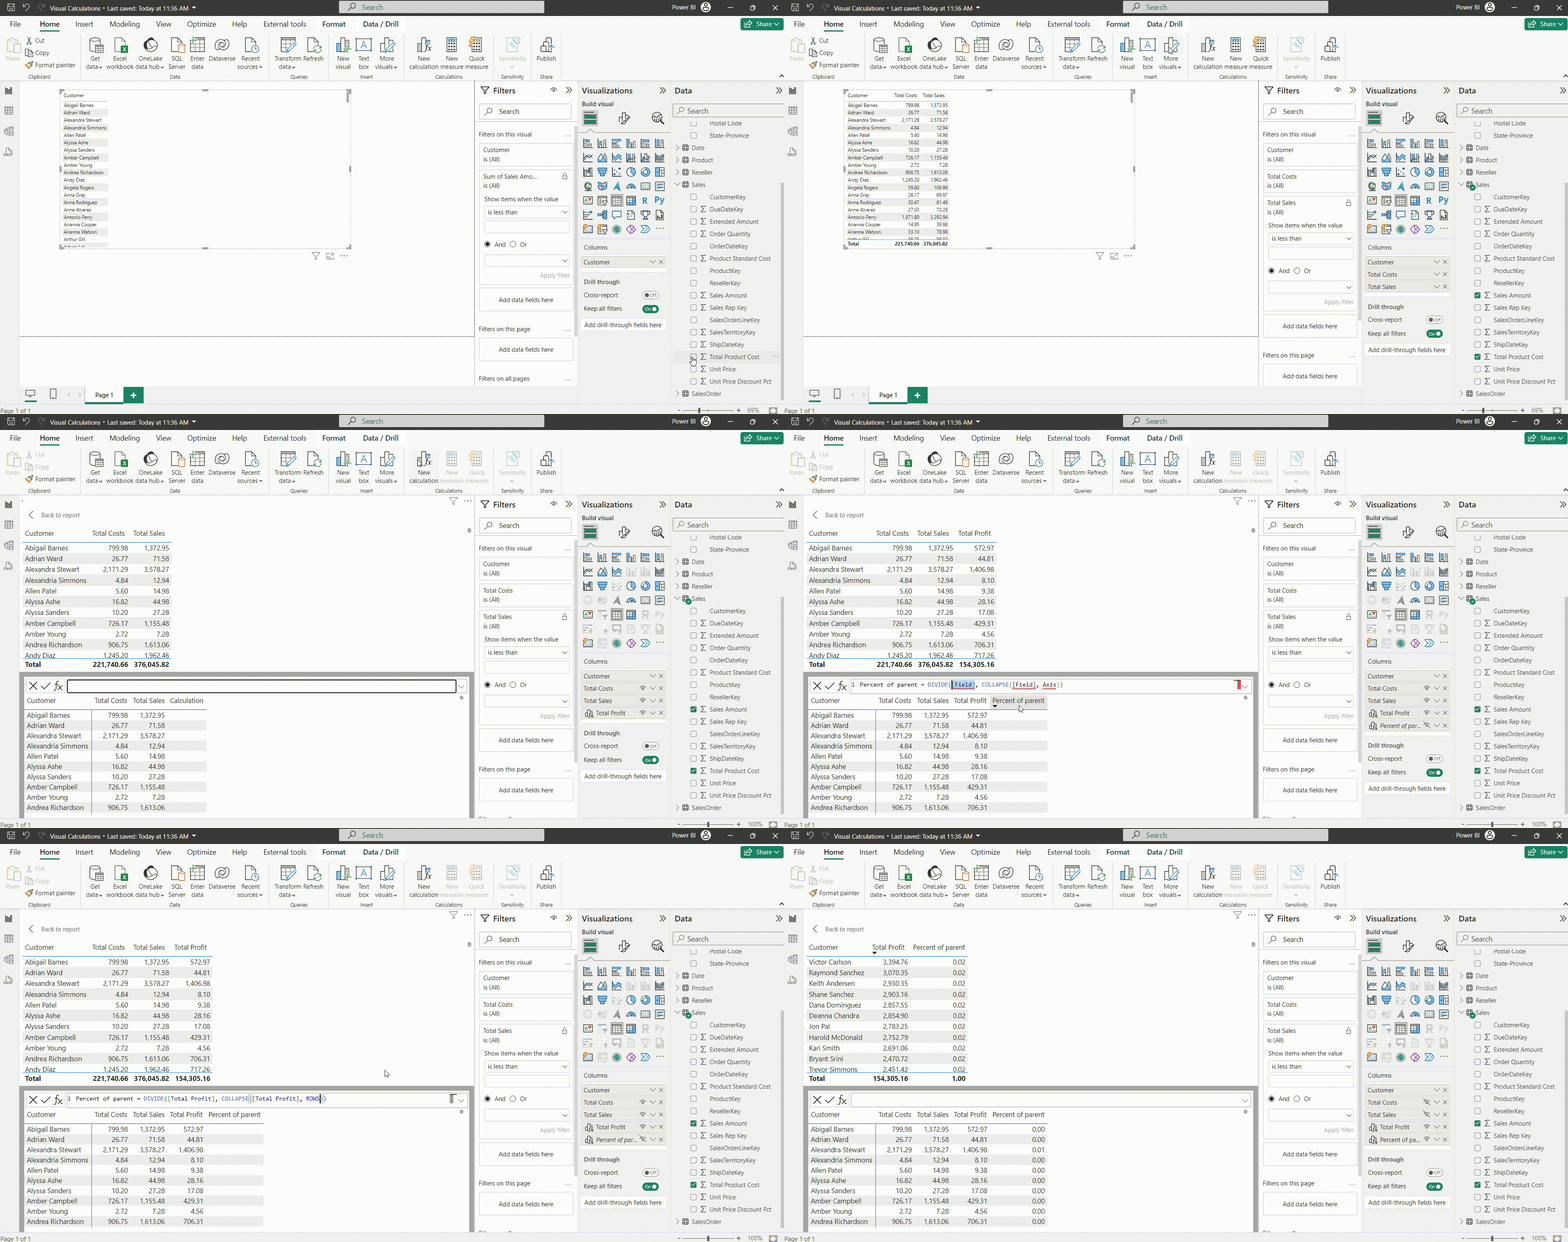
In the first video, we will make two visual calculations on one table.

As you can see, visual calculations make it easy for you to subtract (or add up, divide or multiply) different columns of that visual with each other. A nice characteristic of visual calculations is that you can hide fields on the visual. In our example, it makes it possible to only show profit instead of sales, costs & profit. Furthermore, as seen in the second visual calculation we made, we can call on templates. Templates are there to make common calculations easily; they are predefined functions. Currently (in the public preview of March ’23), we have the following calculations as templates available:
- Running Sum
- Moving Average
- Percent of Parent
- Percent of Grand Total
- Average of Children
- Versus Previous
- Versus Next
- Versus First
- Versus Last
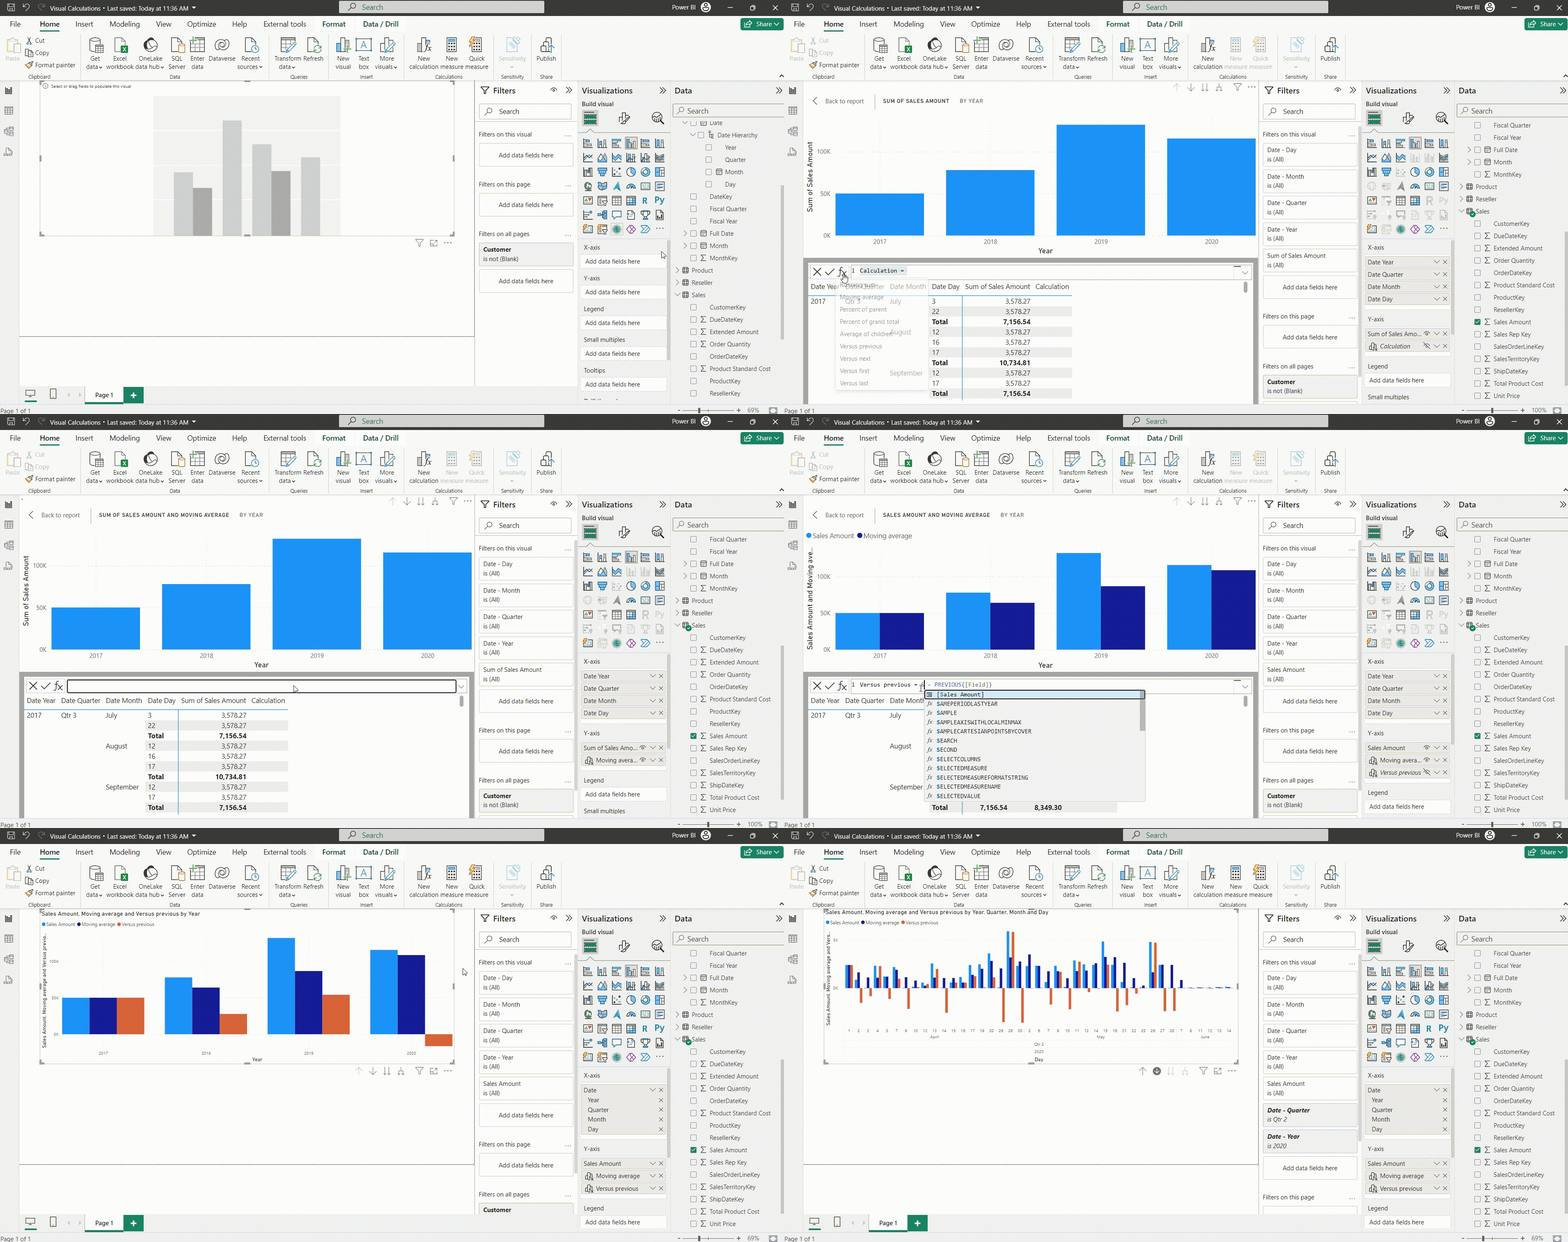
In the video below, we give an example of how the ‘Versus Previous’ template works.

Indeed, the ‘Versus Previous’ takes the difference of the previous and current periods. A strong advantage of visual calculations is that it take into account the different hierarchies. In this example, we can see the moving average and the versus previous not only on day level but also on month, quarter and year level.
Now that you have seen a glance of what visual calculations can do, we need to talk about the drawbacks. First of all, you can’t use Visual Calculations with visuals that use Field Parameters or Calculation Groups. Furthermore, not all visual types are currently supported. It is, for example, not possible to use Visual Calculations on filters and combo charts. Conditional Formatting is also not yet possible for visuals that use Visual Calculations. The biggest drawback, in our opinion, is that Visual Calculations are not reusable. you have to create it for every visual separately. Imagine you have 4 pages with the same visual but different filtering options, then you have to recreate the calculation for all 4 visuals. Nevertheless, in specific cases, when you want to create a one-time thing, visual calculations can come in handy. Next, we need to note as well that you cannot make or change Visual Calculations in the Power BI service. Also, Power BI Embedded is not yet supported for reports that use visual calculations.
Conclusion
We encourage you, for now, to keep on using measures instead of switching to visual calculations. First of all, using measures is a cleaner way of working. In the data tab in the Power BI desktop, we have an overview of all the existing measures (preferably in a _Measure table). Secondly, you have to create a measure only once and can reuse it as many times as you want, while keeping the current filter context. Whereas with visual calculations, you need to create the calculations for every visual separately. Thirdly, you can use a measure on whatever visual you like whereas currently, visual calculations are not available for all types of visualization. Lastly, you can use measures together with calculations groups and field parameters. It is important to note that this is not yet the case with Visual Calculations.
We see many nice opportunities for visual calculations, especially in a self-service way of thinking, but not for now. The feature is not yet mature enough. Let's see what the future will bring!


