Introduction
In the dynamic landscape of business intelligence, Power BI has emerged as a pivotal tool for organizations seeking to extract actionable insights from their data. One of the key challenges in creating meaningful financial reports lies in structuring data tables to align with specific reporting requirements. This challenge becomes particularly pronounced in scenarios where traditional datasets lack the predefined structures necessary for comprehensive financial analysis.
This insight delves into the innovative approach of employing custom table structures in Power BI to address such intricacies, focusing specifically on financial reporting. Traditional financial reporting demands a meticulous arrangement of data, often necessitating the presence of key metrics, such as revenue, across all components to derive a comprehensive total. Likewise, the arrangement of total costs and profit at the conclusion of the table enhances clarity and analytical depth.
When the desired structure is not inherently present in the dataset, Power BI users turn to custom data tables. These tables serve as a pre-defined framework, allowing users to delineate the desired rows and columns. Through this approach, analysts can adapt their measures to seamlessly integrate with the specified table structure, enabling accurate calculations of individual components.
This insight aims to explore the nuances of implementing custom table structures in Power BI for financial reporting, shedding light on the methodology, benefits, and potential challenges associated with this advanced analytical technique. By understanding and harnessing the power of custom tables, organizations can unlock a new level of precision in their financial analyses, leading to more informed decision-making and strategic planning.

The Column-Structure table
Imagine arriving at a client who is currently using a different reporting tool. They visualize a table with a set-up they want to copy-paste into Power BI. For example, they visualize a table, in which the total amount is shown for December Last year, next to the months of the current year, and finally comparing those to some periods.

We can do this in three different ways.
- Create a measure for each of these columns.
- This means we must add measures (among others) for each month of the year.
- 👎🏼This is not a very dynamic approach when we want to combine this with filters on date, and not the best practice.
- 👎🏼We cannot use grouping titles above these measures like ‘Balance End…’ in the example above.
- Use calculation Groups.
- 👍🏼This is probably the easiest and most dynamic way to define our table structure
- 👎🏼Again, when we want to combine these set measures (like end of PY; …) with dynamic ones depending on a certain dimension value (like Jan; Feb; ….), we would have to create a calculation item for each of these months.
- Use pre-defined column names.
- By adding a custom table that defines the structure of the table and using this in combination with a measure that accounts for these column names, we can return a combination of the measures (see option 1) and the dynamic dimension values.
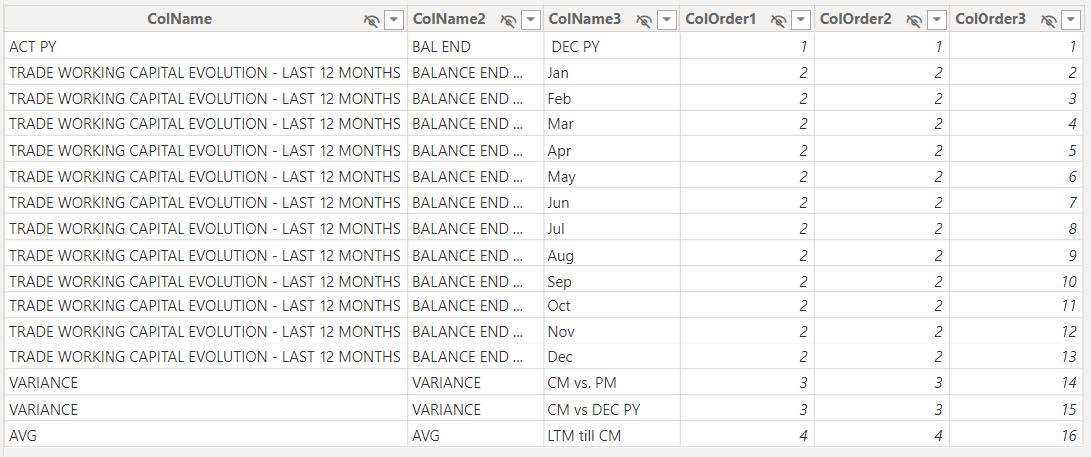
Elaborating on this last option, we need to import a custom table in which the column structure is defined. In our example, the table would look like this:

After importing the custom table that defines the structure and the order of the columns, we need to create a measure that accounts for them. We use a switch statement in our measure to return the right measure depending on the selected value in our structure table.
An example for TWC Actuals where all numbers need to be cumulative:
Balance TWC Actuals =
VAR DEC_PY =
CALCULATE (
_Measure[ACT Amount],
FILTER (
ALLSELECTED ( 'Date'[Date] ),
'Date'[Date]
<= DATE ( YEAR ( MAX ( 'Date'[Date] ) ) - 1, 12, 31 )
)
)
VAR MONTHLY =
CALCULATE (
_Measure[ACT Amount],
FILTER (
ALLSELECTED ( 'Date'[Date] ),
'Date'[Date]
<= EOMONTH (
DATE ( YEAR ( MAX ( 'Date'[Date] ) ), SELECTEDVALUE ( '_TWC Analysis Table Structure'[ColOrder3] ) - 1, 1 ),
0
)
)
)
VAR CM_VS_PM =
CALCULATE (
_Measure[ACT Amount],
FILTER ( ALLSELECTED ( 'Date'[Date] ), 'Date'[Date] <= MAX ( 'Date'[Date] ) )
)
- CALCULATE (
_Measure[ACT Amount],
FILTER (
ALLSELECTED ( 'Date'[Date] ),
'Date'[Date]
<= EOMONTH (
DATE ( YEAR ( MAX ( 'Date'[Date] ) ), MONTH ( MAX ( 'Date'[Date] ) ) - 1, 1 ),
0
)
)
)
VAR CM_VS_PY =
Page 4 of 8
CALCULATE (
_Measure[ACT Amount],
FILTER ( ALLSELECTED ( 'Date'[Date] ), 'Date'[Date] <= MAX ( 'Date'[Date] ) )
) - DEC_PY
VAR LTM =
CALCULATE (
_Measure[ACT Amount],
DATESINPERIOD (
'Date'[Date],
MAX ( 'Date'[Date] ),
-12, MONTH
)
)
VAR OUTPUT =
SWITCH (
SELECTEDVALUE ( '_TWC Analysis Table Structure'[ColOrder3] ),
1, DEC_PY,
14, CM_VS_PM,
15, CM_VS_PY,
16, LTM,
IF ( [Boolean TWC months to show] = 1, MONTHLY, BLANK () )
)

The row-structure table
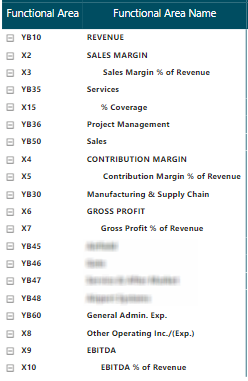
A more complex challenge arises when the client also asks for different computations at row level. For example, a PNL needs to be reported. We have all separate parts of the costs and revenue, but the ‘total profit’ is not an attribute.
| What we need | vs | What we have in the Functional Area Dimension |
|
Image
 |
Image
 |
Therefore, we must define distinct computations for predetermined rows absent in our default dimension. In our custom table example below, the function areas present in our dataset commence with a 'Y,' and this row-structure table is linked to our fact table where these function areas equal 'Y.' Those beginning with 'X' are additions requiring computation. Many of these 'X' function areas are the sums of preceding function areas based on the 'order' column. However, exceptions exist, such as those calculating percentages of the total.
By default, we employ the cumulative sum approach and introduce a 'font column' to identify whether the category is an exception. To determine the structure of the measure, we must establish a decision tree. Initially, if the function area link exists (as is the case for all function areas starting with 'YB'), we simply return the sum of the actuals. When the function area starts with 'X,' we examine whether it is an exception, indicated by a 'font' value not equal to 1 or 0. In such cases, custom calculations are defined. If the 'font' is equal to 1 or 0, signifying a non-exceptional case, we compute the cumulative sum over all preceding function areas with a 'font' value of 1 or 0.

An example of a PNL amount where all numbers need to be cumulative:


Conclusion
The use of custom tables in Power BI for financial reporting offers a powerful workaround to address specific challenges in data structuring. Advantages of leveraging custom tables include enhanced precision in financial analyses, adaptability to unique reporting requirements, and the ability to overcome limitations posed by default dataset structures. By embracing this advanced analytical technique, organizations empower themselves to make more informed decisions and strategically plan for the future. Nevertheless, it is essential to acknowledge potential disadvantages. The complexity of creating and managing custom tables may pose a challenge for some users, requiring a solid understanding of Power BI functionalities and making a handover more difficult. Moreover, the meticulous design of custom tables demands careful consideration to avoid errors and ensure accurate reporting.
The implementation of custom column structures, as discussed, facilitates a dynamic and efficient approach, allowing users to seamlessly integrate measures with specified table arrangements. This method enhances flexibility and clarity in reporting, promoting best practices in data visualization.
However, it is crucial to discern the appropriate scenarios for employing custom tables. Custom column structures prove beneficial when dealing with a combination of dimension values and additional computations, offering a clean and dynamic solution. When there’s no need for dimension values, I would suggest taking a look at the other two options mentioned above (individual measures of calculation items).
Row structure tables become indispensable when intricate computations at the row level are required, surpassing the capabilities of default dimensions. We could of course also solve this problem in the back end by adding certain values to our dimensions and adding calculations to our fact table or creating a separate ‘PNL fact’ table, but I believe this might increase complexity (no longer 1 version of the truth), increase maintenance and cause many issues later on. Keeping the initial values in the fact table is the way to go. Therefore, this option seems like the only valid one. Note that this solution might have a negative impact on the performance, therefore make sure that the calculations don’t become too complex.
To conclude, in situations where the default dataset structures fall short, custom tables emerge as a valuable tool to navigate the intricacies of financial reporting. While alternative solutions might exist, the custom infrastructure tables stand out as a clean, efficient, and practically viable option. By incorporating these innovative approaches into their Power BI workflows, organizations can elevate the precision of their financial analyses, leading to more informed decision-making and strategic planning.


