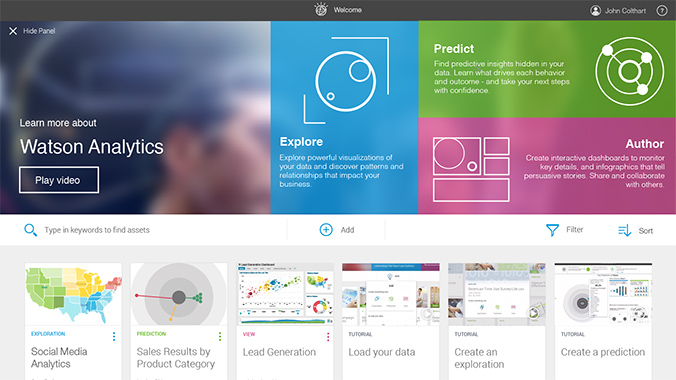
 IBM Watson Analytics is a cloud application that tries to bring sophisticated data discovery and predictive analytics to a business user. The results are displayed in automatic visualisations that can easily be integrated in dashboards.
When uploading data, IBM Watson Analytics will analyse the data and automatically propose a number of relevant questions that can be asked. Own questions can be asked as well, using natural language like What are the key influencers on revenue?
Watson Analytics will answer theses question almost immediately showing the best visualization to support the data. Using predictive capabilities, it is easy to see what drives behaviour. When more detail is required, details can be examined using drill down or by filtering the data further.
Dashboards and infographics can tell compelling stories and can be easily built using a drag and drop interface. Dashboards can be shared with other users, or be downloaded in Microsoft PowerPoint or Acrobat Reader format. Data refinement allows to add secure data sources and join data of multiple sources. It offers broader data source support and allows to access any major data source whether in the cloud or on premise.
IBM Watson Analytics has a free version and a subscription model that offers greater data capacity in number of rows, columns and storage and the ability to access Twitter data. The Enterprise edition allows to connect to other data sources then Excel, like databases, ERP-systems and reporting systems. Users can also share dashboards and collaborate.

Contact us for more information on IBM Watson and how it can integrate in your existing BI & Performance management architecture.