Do you perform ad-hoc analysis on your Power BI datasets? Microsoft just released Power BI Explore, a tool that will make ad-hoc analysis on your dataset much easier.
As a Power BI analyst, you often first want to analyze a new semantic model you just accessed. Before building a report on top of it, you would like to explore the data ad-hoc.
Or a business user who wants to answer a specific business question using the data of the semantic model. The existing report doesn't answer the specific question and creating a report from scratch will be overkill. In this case, Power BI Explore is the right tool to get a quick answer and underpin your answer with data. Also, data engineers who spend most of their time in the data warehouse layer can benefit from this feature to visualize the data without too much effort.
With Power BI Explore, users have a lightweight and focused experience to explore their data. Similar to exporting and building a PivotTable in Excel, users can now quickly launch Explore to create a matrix/visual pair directly in Power BI to get the answers they need without all the distractions and extra complexity of reports.
Using Power BI Explore
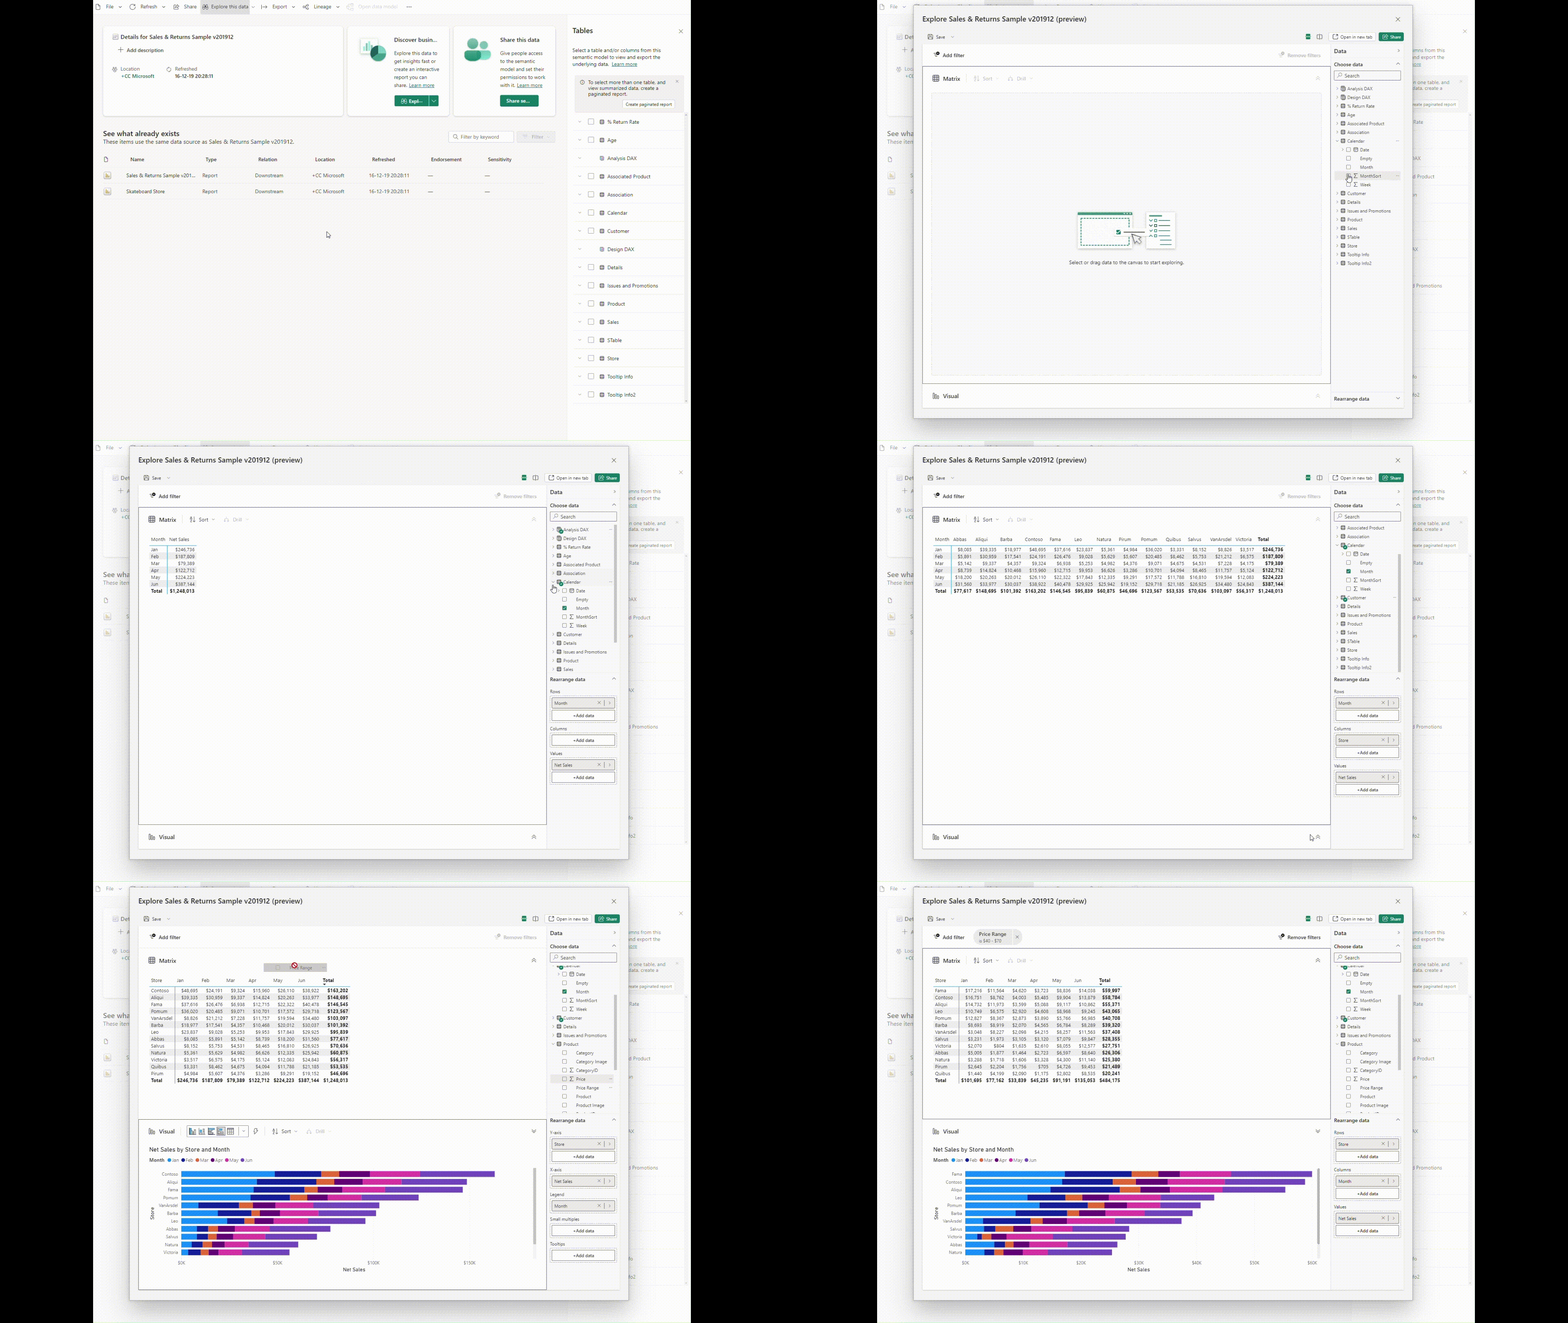
You can start exploring a semantic model, report or Datamart by clicking on the three dots and choosing the 'Explore this data' menu option. You can also begin exploration from the report’s three dots menu while in a workspace list or the report’s menu bar.
Power BI Explore offers a range of features that make it easy to explore and analyze your data. When you launch the explore experience, you'll be taken to a new focused view where your data is displayed on the right. From here, you can edit, drag and drop, or check fields to start building out a matrix or visual. Depending on where you're starting from, the experience will either start with a matrix or a visual. You can expand the visual representation of the matrix on the lower part of the dialog. As you modify what fields are being explored, it will automatically update and select the best visual for that set of fields. You can also use the 'Rearrange data' section of the data pane to adjust which fields are located on the rows and columns. As you build out your exploration, you can take advantage of a new filtering experience by using the Add filter button on the top left to quickly add filters on the fields already in your visual or pick from any fields in your semantic model. The filters are added as pills at the top of the view, so you can easily see what the current filter state is and quickly modify it on the fly.

It's worth noting that when you save your work in Power BI Explore, it's saved as an Exploration file rather than a report. This means that your explorations will sit alongside all the other Fabric/Power BI items in your workspace, and can be easily opened, edited, and shared with others. This approach allows for greater flexibility and collaboration, as explorations can be easily modified and shared with others without the need to create a new report each time.

Power BI Reports, Power BI Explore, Analyze in Excel: which tool to use?
Business users already could perform ad-hoc analysis in Excel by using the 'Analyze in Excel' feature. How does this compare to Power BI Explore and when is creating a report still recommended?
When it comes to ad-hoc analysis, both Power BI Explore and Analyze in Excel are great options due to their ease of use. With these tools, there's no need to create a report beforehand, as analysis can be done on the fly. Additionally, many people are already familiar with pivot tables in Excel, making it an accessible option for many users. However, Power BI has the advantage of offering a wider range of visualization possibilities, although some visuals may not be available in Power BI Explore yet. One of the biggest advantages of Power BI Explore is that visuals are automatically created when selecting data fields, making it easy to switch between different types of visuals. It's worth noting that Excel may struggle with analyzing high volumes of complex data, so it's recommended to use Power BI when dealing with complex and large datasets. Finally, Power BI reports are best suited for repeated analysis. These reports can be automated and made available to others through an app or workspace.

Limitations
The PBI explore feature is currently in public preview. Extra features will be added regularly. As for now, these are the most important requirements and limitations:
- Exploration authors need to build permissions on the semantic model to create an exploration (similar to 'Analyze in Excel').
- When saving, the destination workspace must be in a premium capacity.
- Explore is not currently supported for streaming datasets.
- You cannot create DAX measures in PBI Explore. For complex calculations, Power BI reports are recommended.
- Exploration users need a Pro/PPU license to share.
Conclusion
To conclude, if you are looking for a tool to perform exploratory analysis on your Power BI dataset, Power BI Explore is your tool of choice. An exploration window is created in seconds, bypassing the hassle of creating a report. By using Explore, you enjoy the easiness of using Excel, combined with the power and visualisation capabilities of Power BI. Note that Power BI Explore is not a replacement for Power BI reports. Although you can save your exploration, for complex (e.g. using DAX measures) and repeated reporting, creating a report should be your tool of choice. Yet for a quick and ad-hoc analysis, analysts now have a powerful but convenient tool at their disposal.


