About Euronav
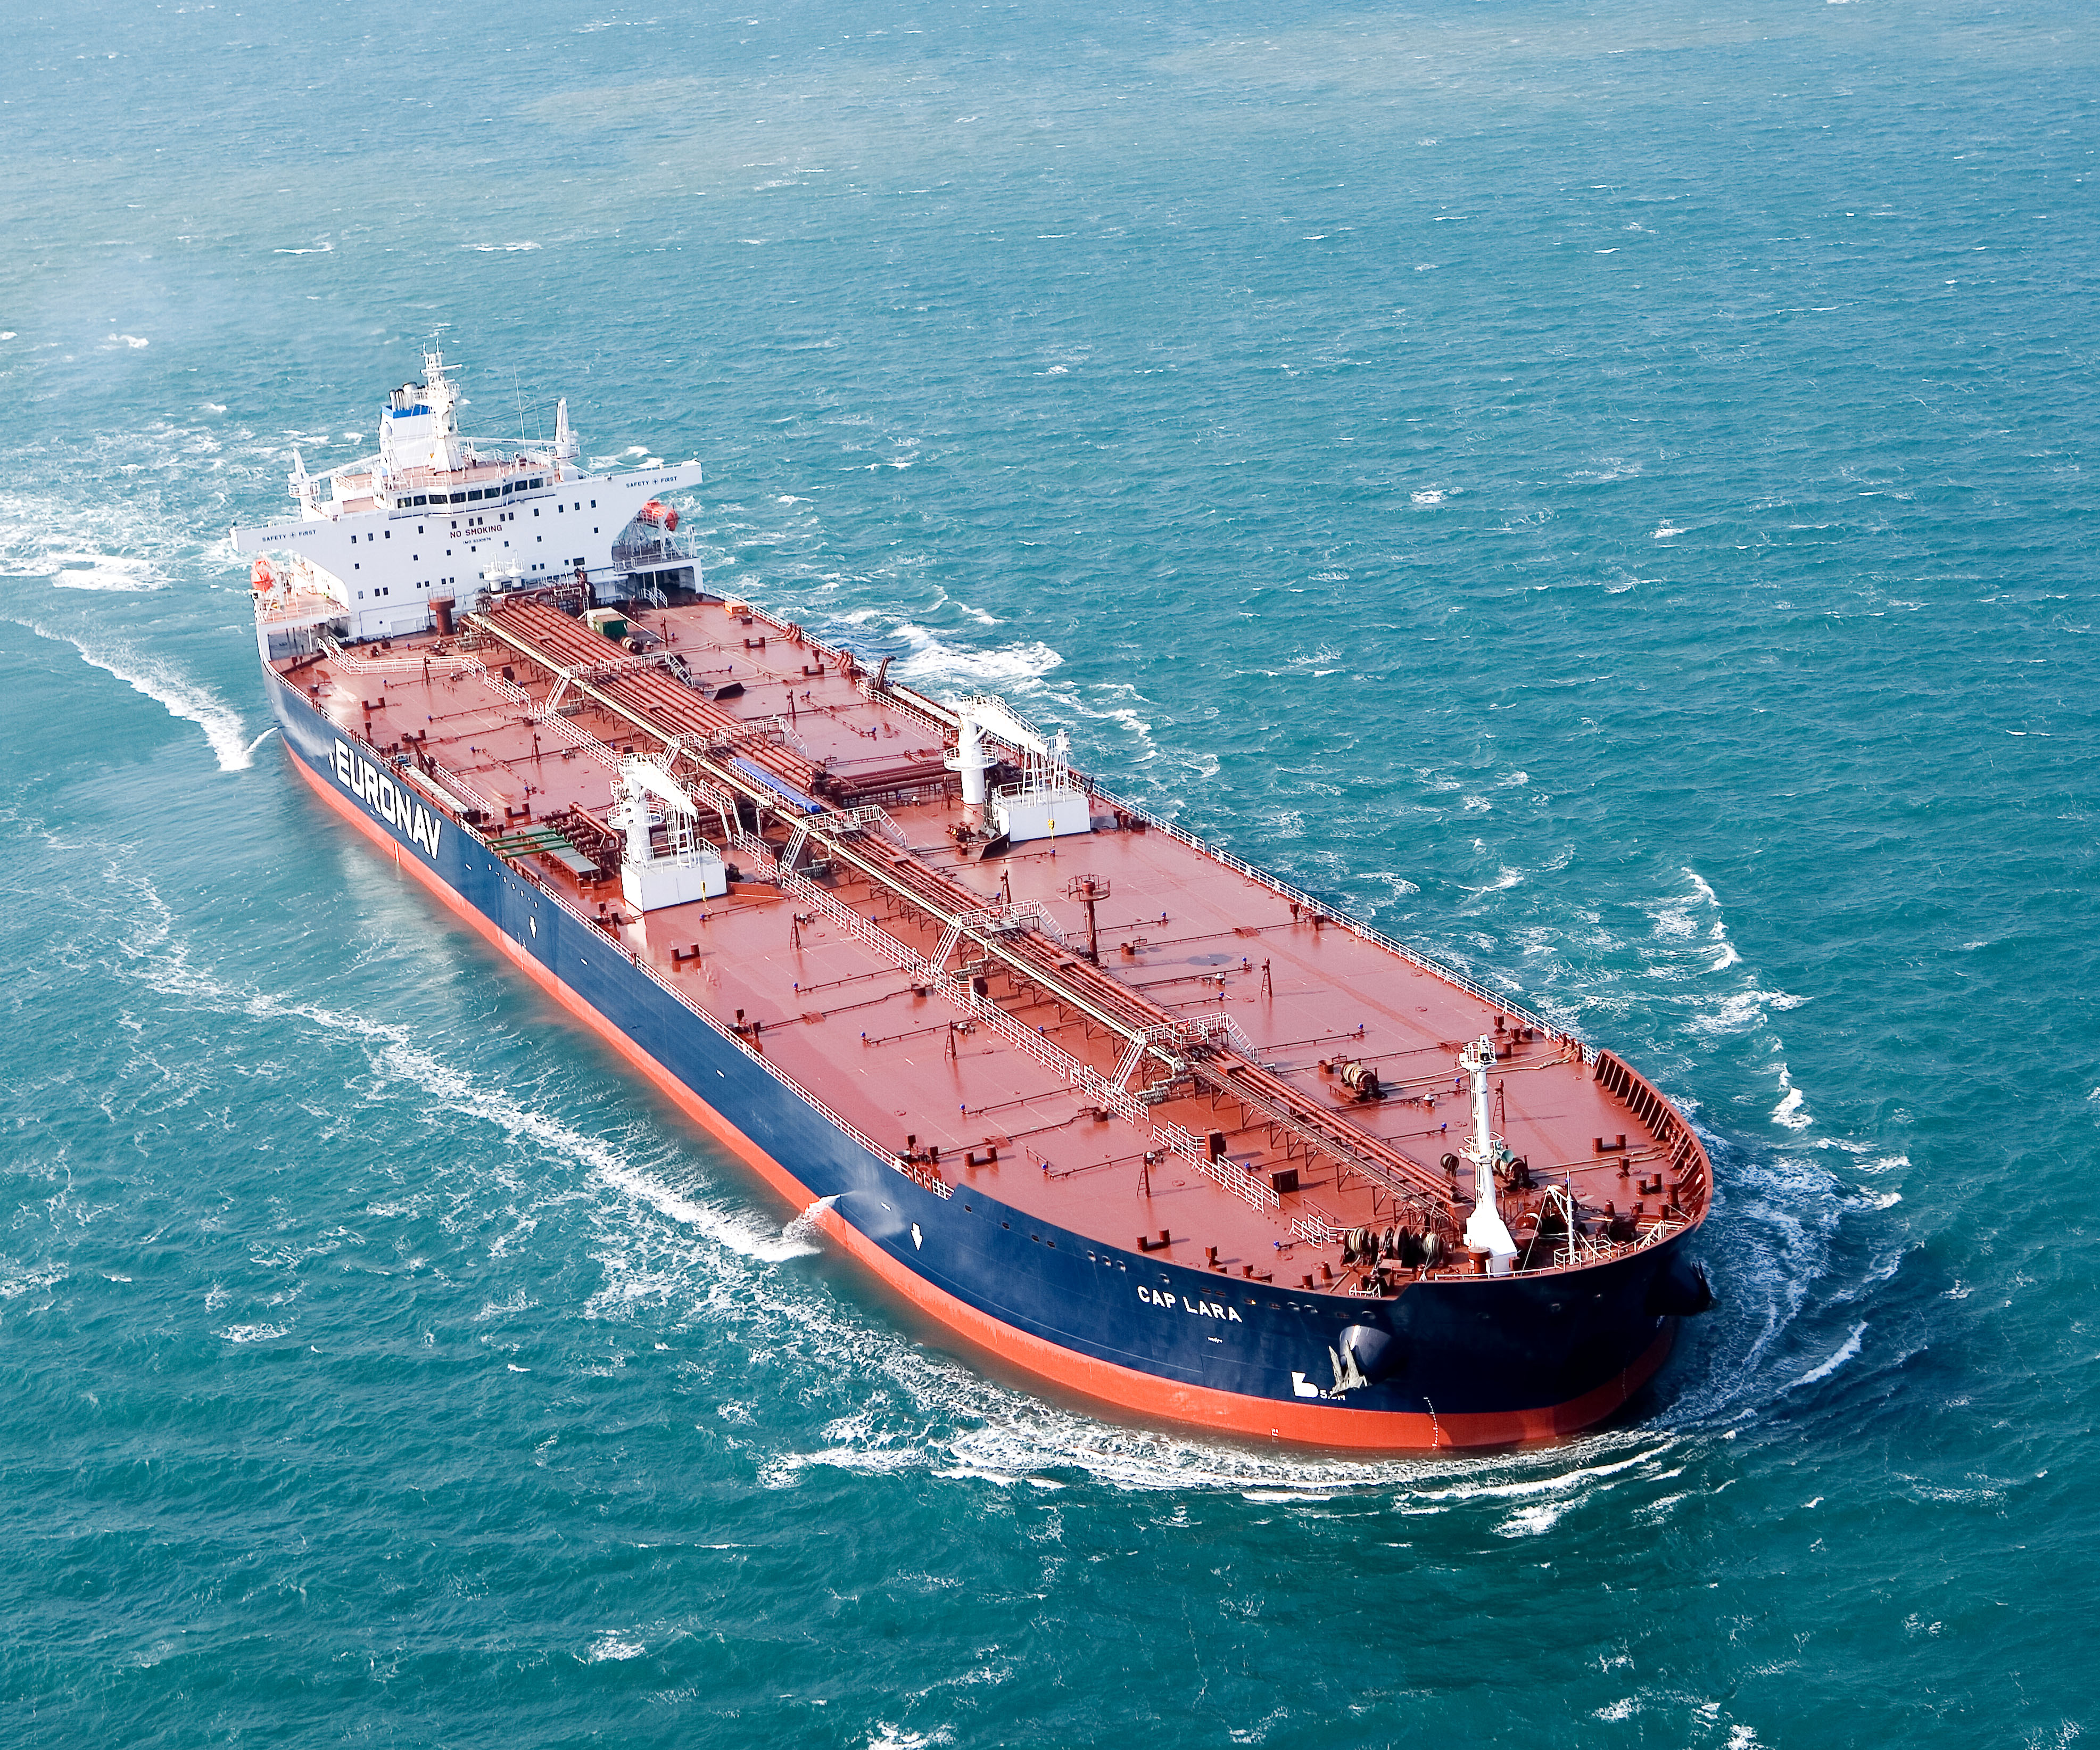
Picture 1 - Cap Lara credits Euronav
Euronav is a Belgian company that specializes in the ocean transportation and storage of crude oil. It is the largest independent quoted tanker company in the world with offices in Europe and Asia. The company prioritizes the safe and reliable operation of its fleet and aims to deliver high-quality services to its customers. Sustainability is also a core value at Euronav, which involves a commitment to safety and environmental protection practices and an innovative approach to technology and information use.
By leveraging the latest technology and analytical tools, the company is well-positioned to continue driving improvements in its operations and maintaining its position as a global leader in the transportation and storage of crude oil.
Head of IT and Innovation, Rudi Vander Eyken defines three primary innovation goals, the first of which focuses on crew safety and welfare. Secondly, the company aims to decarbonize by carefully monitoring fleet performance, consumption, and emissions as such reducing CO2 emissions, an essential contribution towards climate objectives. Lastly, Euronav strives to decrease expenses by employing digital innovation, with fleet performance mapping playing a crucial role in achieving this aim. These last two goals are interrelated, and their technical implementation is executed on a single platform called FAST (Fleet Automatic Statistics and Tracking).
Business Challenge
One of the key challenges Euronav faced was understanding the impact of specific actions on their fleet's efficiency. To address this challenge, element61 and Euronav undertook an extensive analysis of the changes in fuel consumption by performing certain actions on vessels.
We identified three key actions - Drydock1, hull cleaning2, and propeller polishing3 - as significantly impacting vessel efficiency. Through this analysis, we were able to help Euronav answer some critical questions, such as:
- how much do we save by performing these actions, both on vessel and fleet level?
- how much surplus fuel would we consume if we did not perform these specific actions?
- to which specific action can we attribute the fuel efficiency improvement observed each year?
Our analysis has provided Euronav with an overview of how much metric ton fuel, CO2 and corresponding dollars are saved each year.
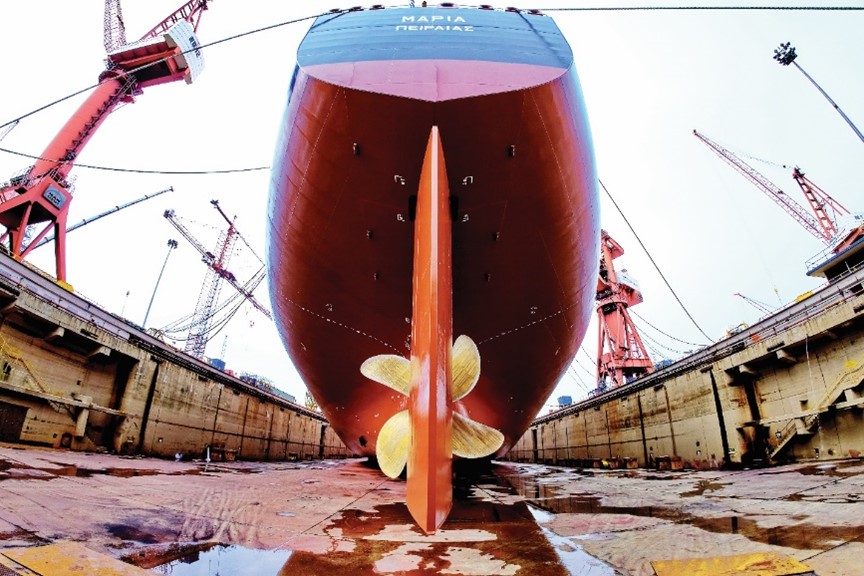
Picture 2 – Maria Dry-Dock (Photographer: Jim Bacalso)
Solution
Source
Our goal is to leverage data from Noon Reports and IoT sources to improve the efficiency and sustainability of the fleet. To achieve this, we first collect the data from both sources and store it in a central location i.e. an Azure Data Lake. This ensures that all our data is in one place and is easily accessible for analysis.
IoT
To collect the sensor data, we use an event hub, which is an Azure resource that reads sensor values from all our ships. The sensor values are stored on the event hub for 24 hours, after which they are deleted.
We use Databricks to stream the data from the event hub to a resource container on the data lake. This ensures that we have a reliable and scalable way of collecting the data. We then use batch jobs to process the data and generate aggregates every 10 minutes, 20 minutes, 30 minutes, and so on.
Finally, we store the processed data in an Azure Data Explorer Cluster. This allows us to perform real-time analysis of the data and gain insights into Euronav’s fleet's performance.
Noon Reports
Noon reports are daily reports that provide information about the status and performance of a ship. These reports typically include information about the ship's position, speed, fuel consumption, and other important metrics. Noon reports are used by ship operators to monitor the performance of their vessels and make decisions about how to optimize their operations. They are called noon reports because they are usually generated at noon each day.
Methodology

Phase 1: Design
Essentially, our aim is to estimate the fuel efficiency gain because of the various actions. Due to the numerous factors affecting a ship's performance, we chose a random forest regression model to forecast the fuel consumption in varied conditions. To accomplish this, we use MLflow on Databricks.
Phase 2: Implementation
MLflow is an open-source platform for managing the end-to-end machine learning lifecycle. It provides tools for tracking experiments, packaging code into reproducible runs, and sharing and deploying models.
Databricks is a cloud-based big data processing platform that provides a unified analytics workspace. One of the many tools available in Databricks is the MLflow integration, which enables data scientists to easily manage their machine learning workflows within Databricks.
Overall, MLflow provides a straightforward way to track, reproduce, and share your machine learning workflows within Databricks, which can help you iterate more quickly and efficiently. It can also help you collaborate with other data scientists and stakeholders by providing a central location for all your experiments and models.
Once we trained and saved our machine learning model in MLflow, the next step is to deploy it for scoring. One common approach is to create a scoring pipeline that loads the saved model and applies it to new data. With Databricks and Azure Data Factory, you can easily automate this process and schedule your scoring pipeline to run on a regular basis.
After scoring the data, we write the results back to the data lake. This ensures that the results are available to all stakeholders and can be used for future analysis.
Finally, we visualize the results in Power BI. This tool allows us to easily create interactive dashboards that provide insights into the performance of our fleet. We can use these insights to identify areas where we can improve and make data-driven decisions.
Benefits
The use of data science and machine learning in Euronav's fleet management has brought significant benefits. By leveraging data from Noon Reports and IoT sources, Euronav can now accurately measure the impact of specific actions such as drydock, hull cleaning, and propeller polishing on their fleet's fuel efficiency. Which will enable them to make data-driven decisions that result in significant fuel and cost savings, as well as a reduction in CO2 emissions.
Furthermore, the use of MLflow in Databricks has allowed Euronav to easily manage their machine learning workflows and collaborate with other data scientists and stakeholders, while the integration with Azure Data Factory has automated the scoring process and ensured the results are available to all stakeholders for future analysis. The visualization of results in Power BI provides stakeholders with a clear and interactive view of the fleet's performance, enabling them to identify areas for improvement and make better-informed decisions. Overall, the use of data science and machine learning has helped Euronav improve the efficiency and sustainability of their fleet.
1Drydock is a maintenance process where a vessel is taken out of the water and placed in a specialized facility for repairs, inspection, and maintenance. It allows for thorough cleaning and repairs to be carried out on the vessel's hull and other components.
2Hull cleaning is the process of removing fouling, such as algae, barnacles, and other marine organisms that accumulate on the hull of a vessel over time. Hull cleaning is necessary to maintain the vessel's performance, reduce fuel consumption, and prevent corrosion.
3Propeller polishing is the process of removing any accumulated fouling, such as barnacles or algae, from a vessel's propeller blades. Propeller polishing can help improve the vessel's performance and fuel efficiency by ensuring the propeller is working at its optimal level.
