(written by Justin Zwijns - element61 Trainee in 2022)

What is Automated Machine Learning?
Automated Machine Learning, later referred to as AutoML, is the automation of training a machine learning model from labeled data to predict or classify something. AutoML replaces the iterative task of training and validating machine learning models. This feature is available in the Power BI service. It should be noted that AutoML is only available in a workspace from a Premium or Embedded capacity, with the AI preview feature turned on.
AutoML offers three different models:
- Binary prediction: predict whether or not an outcome will be achieved
- General classification: distinguish between three or more outcomes
- Regression: estimate a numerical value
To train these models, the tool uses the AutoML capability in Azure Machine Learning.
Why use AutoML?
As a business user, you can create, train and deploy a machine learning model within a few clicks. This avoids the time-consuming and iterative tasks of trying to find the best model. AutoML is a no-code tool, so no programming knowledge is required.
After giving Power BI the time to train and decide on the best model, it automatically generates a training report. This report gives an overview of the model performance and training details. The report can be edited in the service or by downloading it. The underlying data of the report reveals even more details about, for example, the training iterations and the final results. Thus, the report and data can be used for further reporting and understanding of the model.
Building an AutoML model
Dataflow
In the dedicated workspace, a dataflow must be created. A dataflow is a collection of one or more tables where those tables can be prepared, cleaned and transformed with Power Query. Scheduled data refreshes are available for dataflows.

With only Power Query at hand, complex data transformations and pulling data from many different sources becomes a difficult task. During our experiments, one clean dataset was always used per model. However, there were difficulties with very large datasets (over 3 million rows) and especially editing tables in a dataflow after creating it.
Creating and training the model
After creating the dataflow, a machine learning model can be added to the dataflow. For the example explained below, a binary prediction model was used. The dataset Online Visitors was pulled from the Microsoft documentation. The goal of the machine learning model will be to predict whether an online visitor will make a purchase or not (true/false).
The steps to create a binary prediction model are as follows:
- Select the table and then the column to predict (outcome column)
- Choose a model: based on the column you selected, Power BI recommends one of the three models. In our case, it makes the most sense to use the binary prediction model. In the same step, the target outcome (most favored value) must be selected and labels for whether the prediction matches the target value have to be entered. The target outcome here is true.
- Select the data you want to include in the training: based on a sample of the data, Power BI selects columns that have some or high correlation with the outcome column. The higher the correlation, the better. In turn, this may generate more accurate outcomes. If Power BI doesn’t recommend a column, it will explain why. Because they are only suggestions, the selections can be altered.
- Name and train the model: enter a name and select the maximum training time. There is a minimum of 5 minutes and a maximum of 360 minutes. Important to point out here is that the allocated time represents the maximum amount of time given to Power BI to train. So, a model with a small dataset and an allocated time of 60 minutes may finish training after 20 minutes.

Power BI states that it takes a statistically significant sample of the data and trains the machine learning model using 80% of that sample. The other 20% of the data is used to test the model. Both sets can be found in the same dataflow. In reality, this is not always true. For the model above, the split was 64/36. In the other cases we made, the split was 56/44 and 80/20.
Provided with the necessary information, Power BI will then start training the model. Depending on the given time to train, it will run several iterations trying to find the best model. Next to the machine learning model, in the dataflow, the status will appear as ready right after clicking save and train. This means the model is in line to be trained or is being trained. When Power BI is done training, the status changes to trained.

Training report
The next thing Power BI will do is generate a training report, which is always based on evaluations of the test set. The report is accessible by clicking on view training report in the machine learning models tab or in the dataflow. As previously mentioned, it can be edited and downloaded. The training report contains different content depending on the model. For a binary prediction model, there are three pages: model performance, accuracy report, and training details. Below, you can find a description of what these pages are about.
Model performance contains a confusion matrix and a cost-benefit analysis. A few other details can be found on the top of the page: how the model was evaluated, the model performance featuring the Received Operating Characteristics (ROC) curve, and the top predictors. By clicking on the top predictors, Power BI gives an overview of the top predictors. They are based on how much they influence the target column. It’s also possible to view a breakdown of every top predictor. The ROC curve will be discussed later.
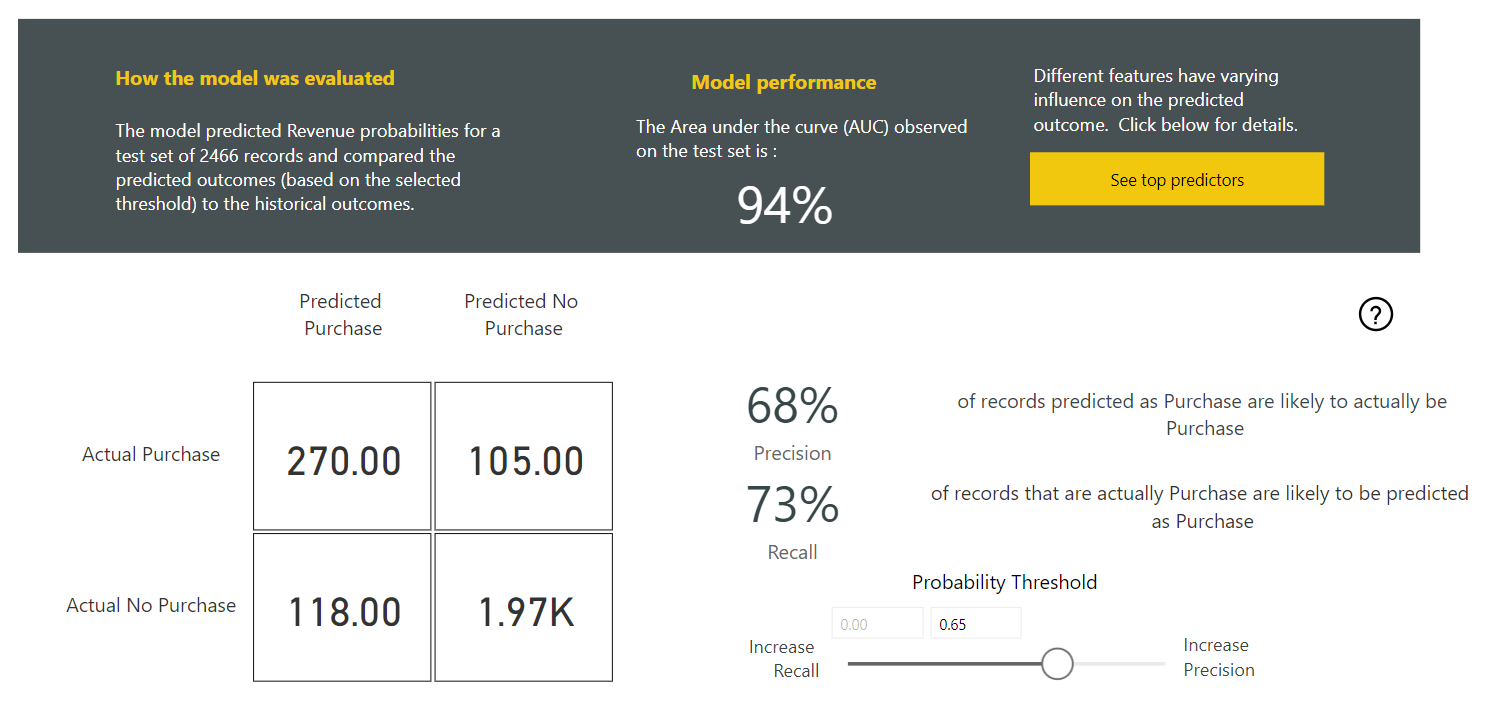
The confusion matrix visualises the performance of the classification model (true/false, in this case Purchase/No Purchase). It contains the True Positives, False Negatives, False Positives and True Negatives. Recall and precision are calculated from the confusion matrix. Precision equals and recall equals
. A more detailed explanation can be found by clicking on the question mark bookmark. There are more of these throughout the report to explain visuals.
It is almost impossible to have extremely high precision and recall at the same time. This is where the probability threshold slider comes into play. The model will calculate a probability between 0 and 1 for each prediction. Everything above a certain threshold will then be treated as a positive prediction and everything below as a negative one. Recall can be increased at the cost of a lower precision and vice versa. Looking for the best threshold is important because it serves as input when applying the model to the full dataset.
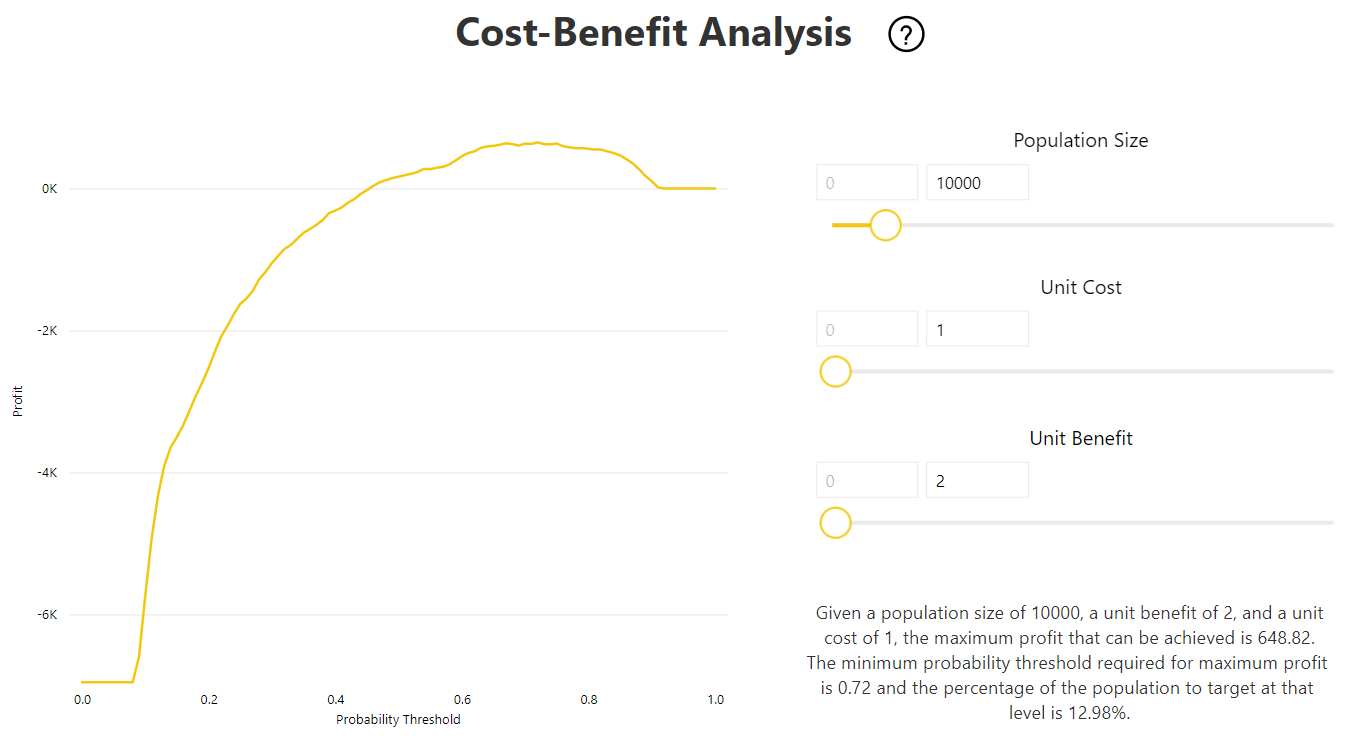
The second half of the model performance page features a cost-benefit analysis (CBA). This is certainly convenient for a business analyst. The graph and description will give an idea of what the monetary impact will be when an organisation needs to make an investment for targeting customers with the highest predicted probability. Because those visitors are likely to yield the highest benefit. The numbers on the visual are standard and only serve as an example. Sliders are available to change them.
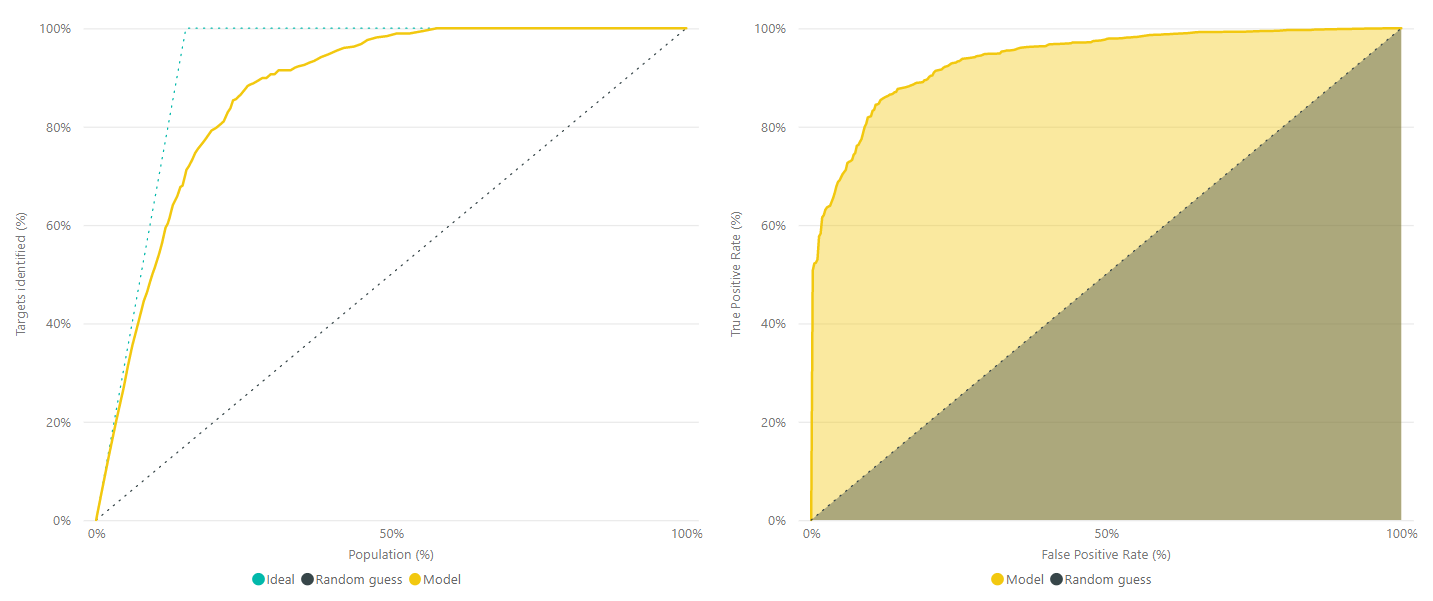
The second page of the report is the accuracy report. It contains a cumulative gains chart and the ROC curve. A cumulative gains chart, on the left, shows what percentage of rows with the target outcome (targets identified) can be detected by targeting a percentage of the total rows (population). So, for example, 15% of the total rows are expected to contain 70% of the target outcome rows. The closer to the ideal model line, the better the performance of the model.
On the right is the ROC curve. It contains the rate of correct positive predictions and the rate of false positives. The higher the curve, the better the model is at predicting positives as positives and negatives as negatives. An ideal model identifies all true positives with zero incorrect predictions. The total percentage covered by the curve is usually referred to as area under the ROC curve (AUC).
The last page contains the training details. It shows the number of sampled and training rows, the final model’s name, and the number of iterations. There is also a line chart that shows the model quality from every iteration, with details like algorithm name, score, and sometimes, depending on the algorithm, parameters.
The extracted features of the input data and the final parameters are also shown. The final visualisation is a donut chart. It displays the ensemble machine learning models if they were used. An ensemble method uses multiple algorithms with the aim to generate better predictive performance than from one algorithm.
Applying the model
The next step is to apply the model to the data. As previously mentioned, the wanted probability score serves as input here. After applying, Power BI generates two tables: the original table with four added columns and an explanation table with the contribution of every feature to the final score. The four added columns are: predicted outcome, probability score, top influencers and explanation index. The data that comes from applying the model to the data, can be used for reporting on the predictions the model has made.
Editing the model
If the model needs to be fine-tuned, an edit button is available. It is important to point out that only the third and fourth step can be changed, selecting training data and naming and training the model.
Pros and cons
| + Automated Machine Learning | - Limited data preparation |
| + No code | - Can't handle very large datasets |
| + Training report | - Difficult to edit tables in dataflows |
Power BI AutoML versus Databricks
Databricks is a tool to use for creating machine learning models as well, but manually with languages like Python. With the rise of automation, how does AutoML from Power BI compare to Databricks? The following chapter highlights some of the major differences and is a result of a number of discussions with colleague Floriant Sturm, a data scientist.
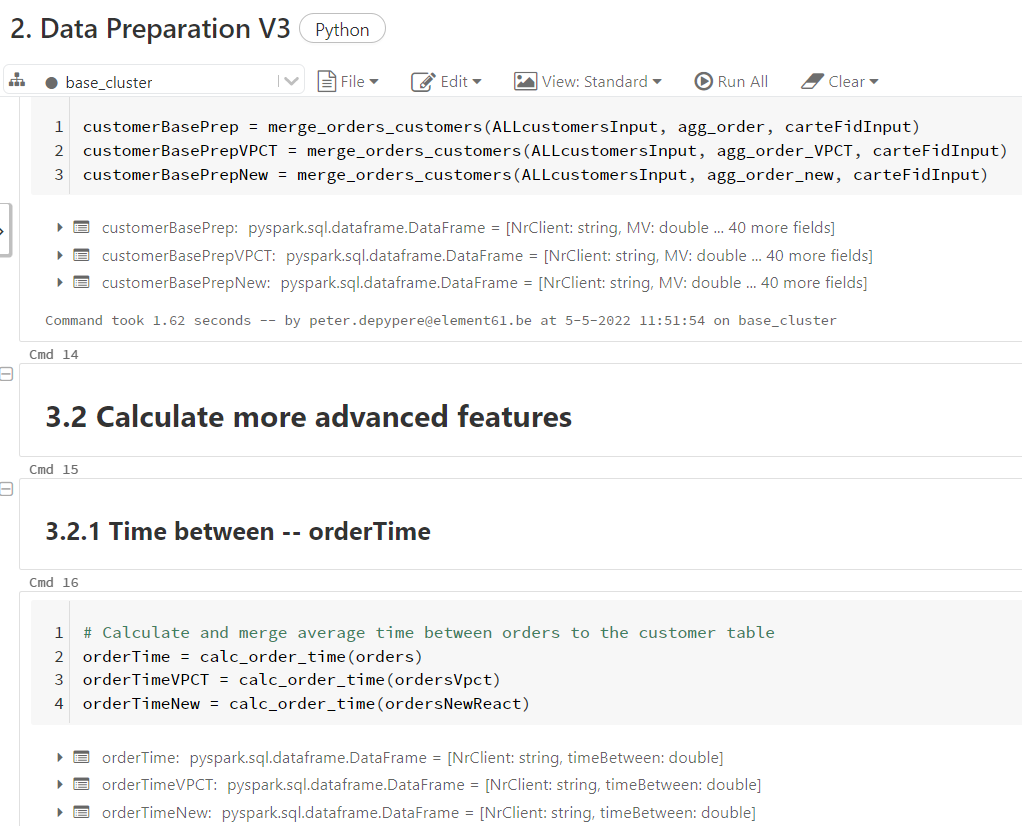
As mentioned at the beginning of this insight, the data preparation for AutoML in Power Query is limited. But within Databricks, multiple sources can be managed and it’s easier to aggregate data and create new features. Doing calculations is also possible in Databricks.
In Databricks, the trained models can be accessed from a clear, structured and detailed overview. The overview in the dataflow of Power BI becomes very cluttered and overwhelming when dealing with many models and training reports.
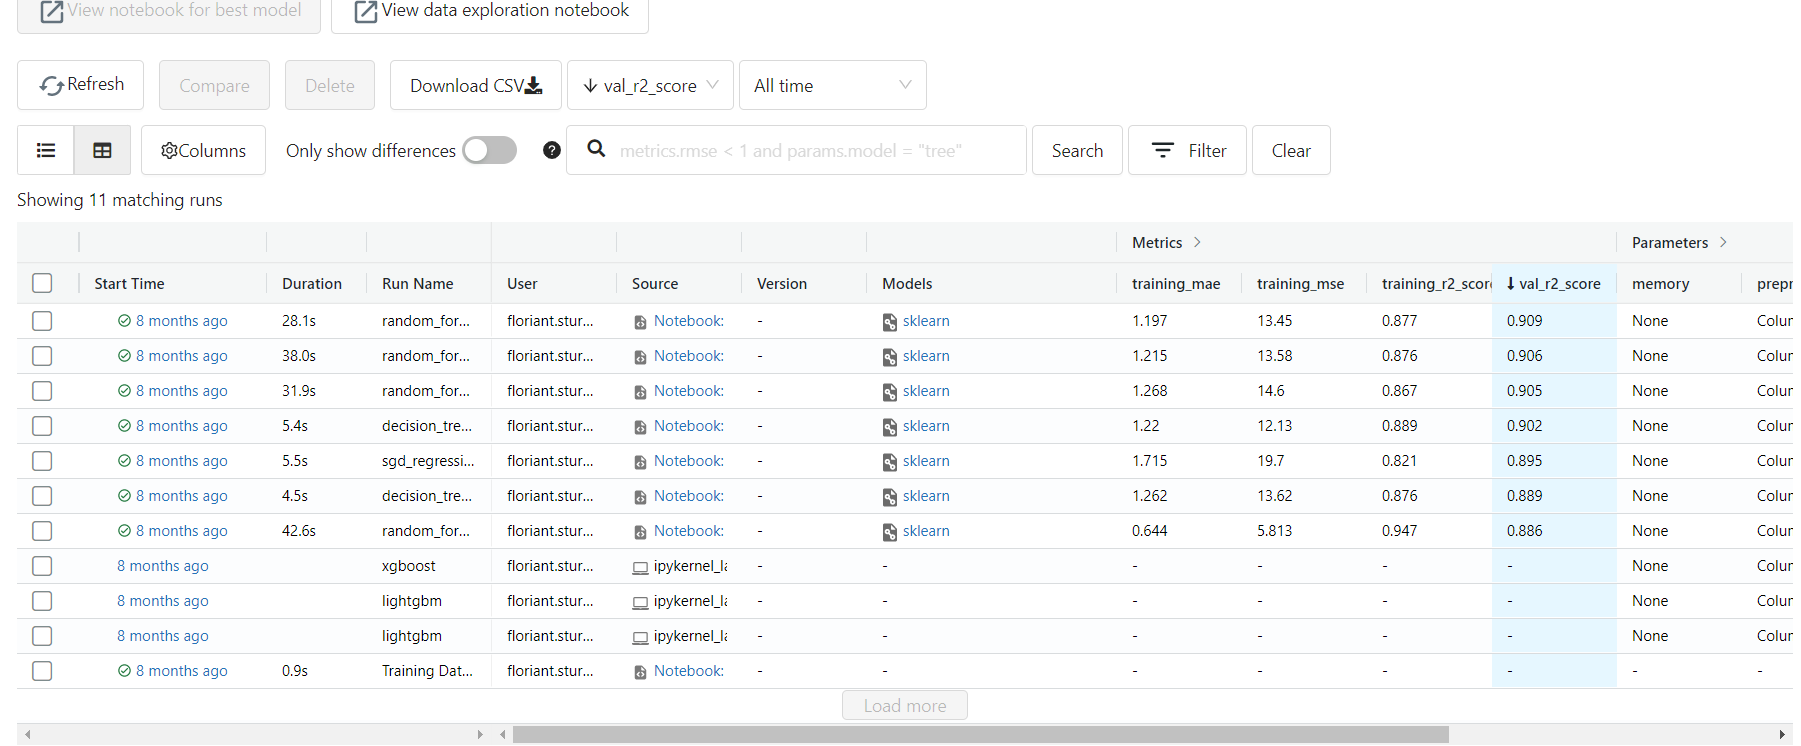
By clicking on a model, the details can be inspected. This way the models can be evaluated and compared quickly to determine whether the models are good or should be fine-tuned. That is a very important step in the iterative process of machine learning.
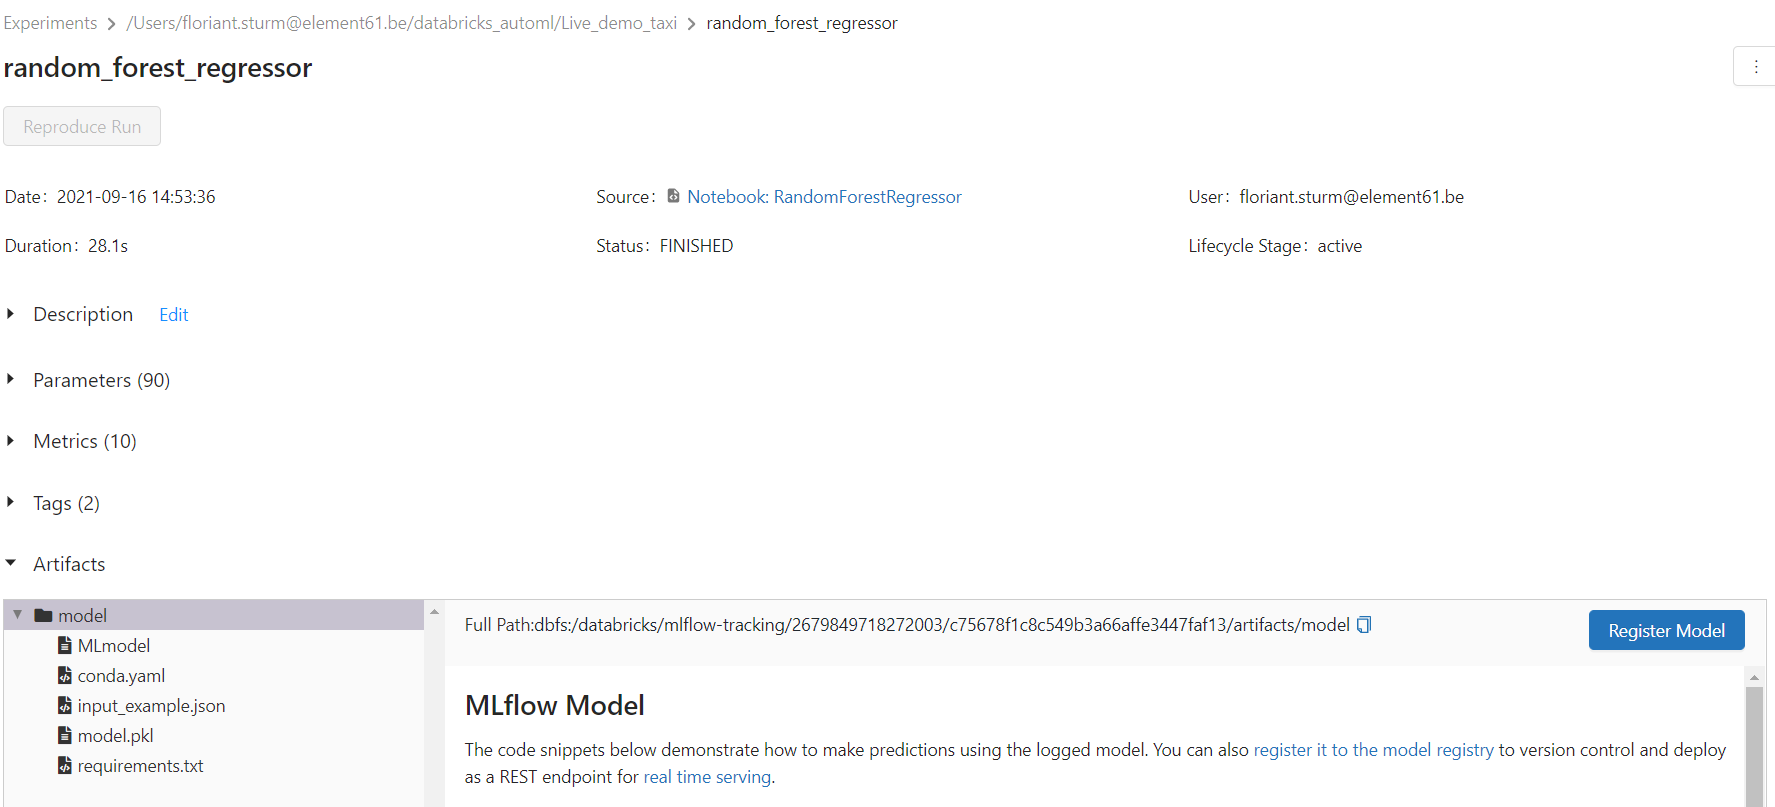
Finally, Power BI reveals a lot of information about the model in the report, including model parameters, iteration details and a breakdown of the probability distribution. So AutoML isn’t a complete black box. Nonetheless, for a non-data scientist, all of the underlying information of the model is not easy to interpret. So that information can be passed on to a data scientist as input for creating a model in Databricks.
Passing on data can also work the other way around. There can be a flow from data scientist to, for example a business analyst. The data scientist does the necessary steps of data preparation in Databricks. For example, in a situation where there isn’t much time, the data scientist could then pass on a clean dataset to the business analyst. After that, AutoML can be used to quickly get a machine learning model.
To conclude this comparison, Databricks has a great overview on all models and is better to use for extensive data preparation. It is also the best option when there is a data scientist with machine learning expertise available. Power BI AutoML is suitable when little data preparation is necessary and a no-code quick insight is favoured.
Conclusion
Power BI AutoML is a simple solution for rather small projects where less data preparation is needed. It is a very accessible tool. Coding skills aren’t required and throughout the training report, there are explanations of how to interpret a result. The key message from the comparison between Power BI AutoML and Databricks is that Databricks is recommended for projects in case of extensive data preparation, an available data scientist with machine learning expertise and enough time. Choose for Power BI AutoML in case of no machine learning and coding expertise, limited time and little data preparation.


