Lakeview Dashboards is a new feature in the Databricks ecosystem and is positioned as the successor of Databricks SQL dashboards. It has been released in public preview since its release in September 2023 and is intended to serve as a pivotal point for users to create, share, and analyze data insights seamlessly within the Databricks platform. In this article, this new feature in Databricks is explored and compared with SQL dashboards and Power BI dashboards.
TL;DR
- Databricks Lakeview dashboards have improved user-friendliness over SQL dashboards.
- To be usable by business users, Databricks Lakeview dashboards still lack a number of features and functionality.
- For now, Databricks Lakeview dashboards might be useful for closely collaborating teams of data scientists or data engineers within Databricks.
What are Lakeview Dashboards in Databricks
Lakeview Dashboards are a new data visualization tool within the Databricks ecosystem. Introduced in public preview on September 28, 2023, these dashboards offer a dynamic platform for visualizing and sharing data insights within Databricks. Comprising two key components — Data and Canvas — Lakeview Dashboards provide users with a comprehensive toolset for creating, analyzing, and disseminating data-driven insights. For the moment, they are not intended to replace tier-one dashboarding tools, such as Power BI and Tableau. However, they might make it easier to create simple dashboards that can be shared within and between teams. Below, we make a comparison of these Lakeview Dashboards with Power BI and SQL dashboards and explore their features step by step.
Databricks Lakeview dashboards in the realm of BI tools
While the user experience in Databricks Lakeview dashboards has improved of Databricks SQL dashboards, it can be noted that Lakeview dashboards still lack some functionalities that are often needed in BI tools. While Databricks does not aim to compete with tier-one BI tools, such as Power BI, it still needs to up its game to make these dashboards more functional and intuitive. Dimensional data models can be used after explicitly joining all needed dimension tables on the fact tables in a custom query, contrasting the drag-and-drop user experience in Power BI. Filtering on multiple fact tables using common dimensions is also possible, but not as intuitive as it is in Power BI.
Next to the lack of support for dimensional data models, the slicer options are not optimal yet. For numeric data, the user only has the possibility to use single or multiple select data. Filtering on a range of values is not yet possible in the public preview and is certainly a must-have for the public release. Also, drill-down and drill-through possibilities are missing, both being absolutely essential features contributing to the dynamic nature of Power BI dashboards.
The lack of these dynamic features makes Lakeview dashboard, for now, not usable for business users. Where Databricks Lakeview dashboards might find a place, however, is in a development environment where people within a team need to collaborate closely. It could serve as a tool for gathering quick insights into data while staying in the same environment where the data transformations happen and data lineage can be performed for backtracking the origin of data. Below, the most important features of Lakeview dashboards are highlighted.
Features
In comparison with Databricks SQL dashboards, Databricks Lakeview Dashboard contain a number of new and updated features. These include the following:
- A separate data and canvas tab
- New possibilities for separate development and production environments using draft and publish mode
- Updated visualization library
- Data lineage visible within the published dashboard
- ...
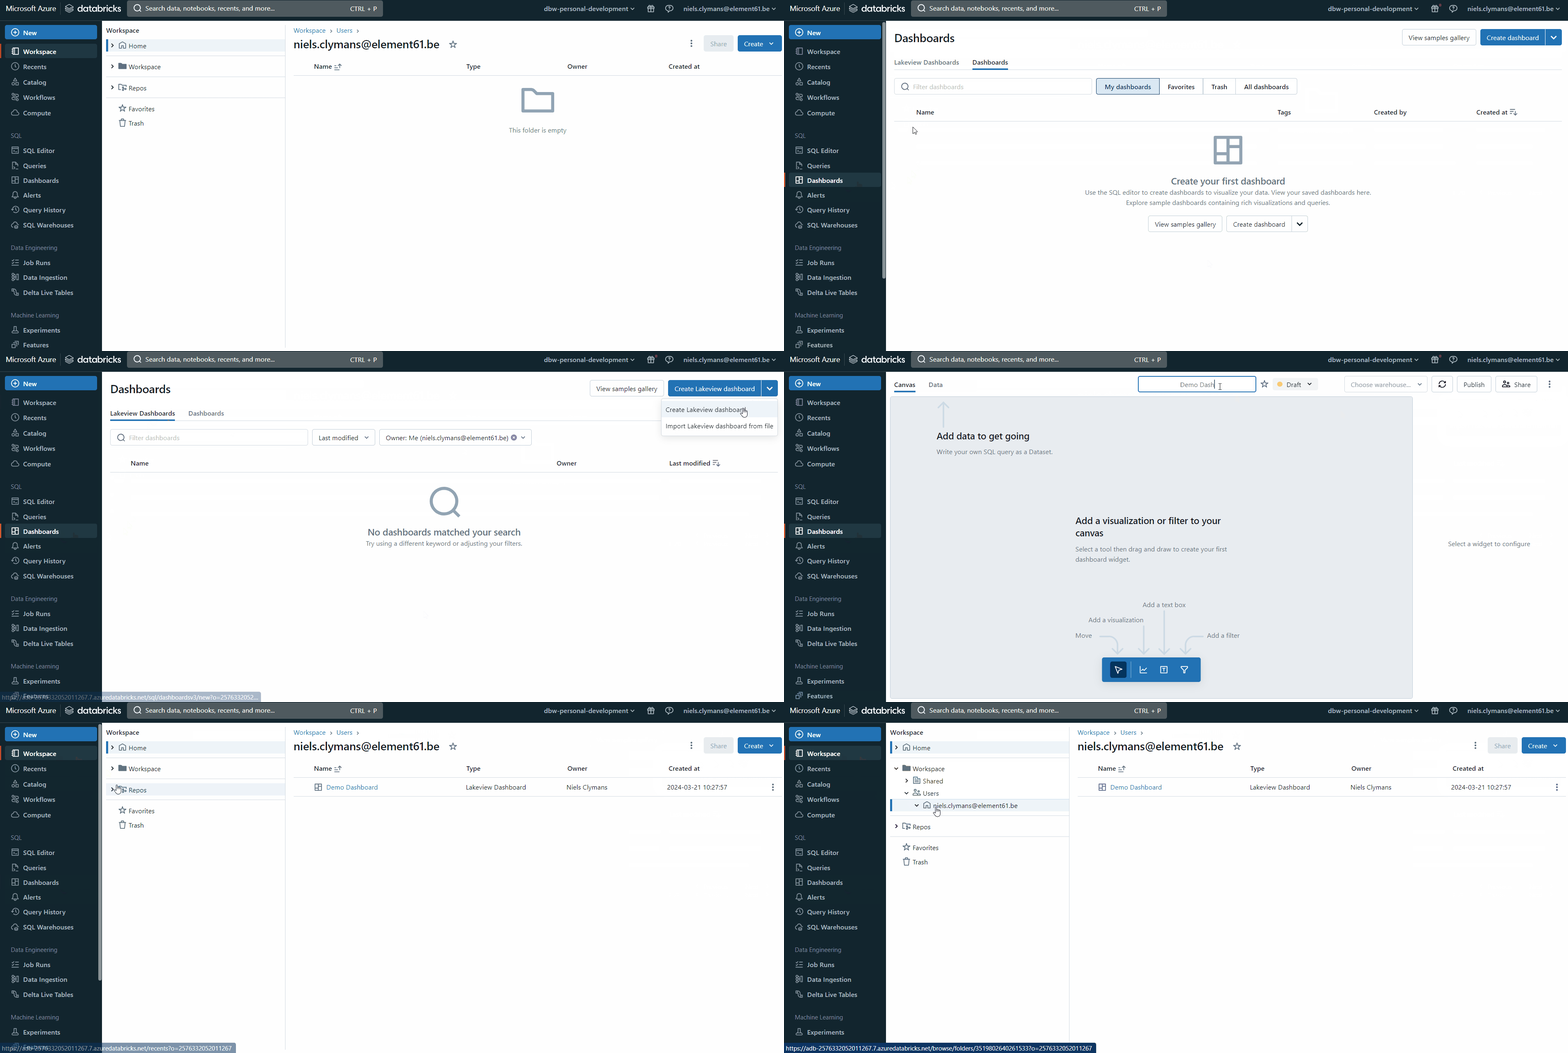
To check out the features in Databricks Lakeview Dashboards, first, a new dashboard needs to be created. This can be done by navigating to SQL > Dashboards > Lakeview Dashboards and clicking in the top right on the butting 'Create Lakeview dashboard'. Each dashboard created this way is stored in Databricks under /Workspace/Users/<your_username>. Alternatively, a Lakeview dashboard can also be created by navigating to the location where you want to save it, clicking on the blue 'create' button and selecting 'Lakeview Dashboard'.

Data and canvas tab
The new Databricks Lakeview dashboard contains two tabs: the data tab and the canvas tab. In the data tab, a selection can be made of tables and views from the unity catalog. Alternatively, also custom queries on these tables and views can be defined and selected.

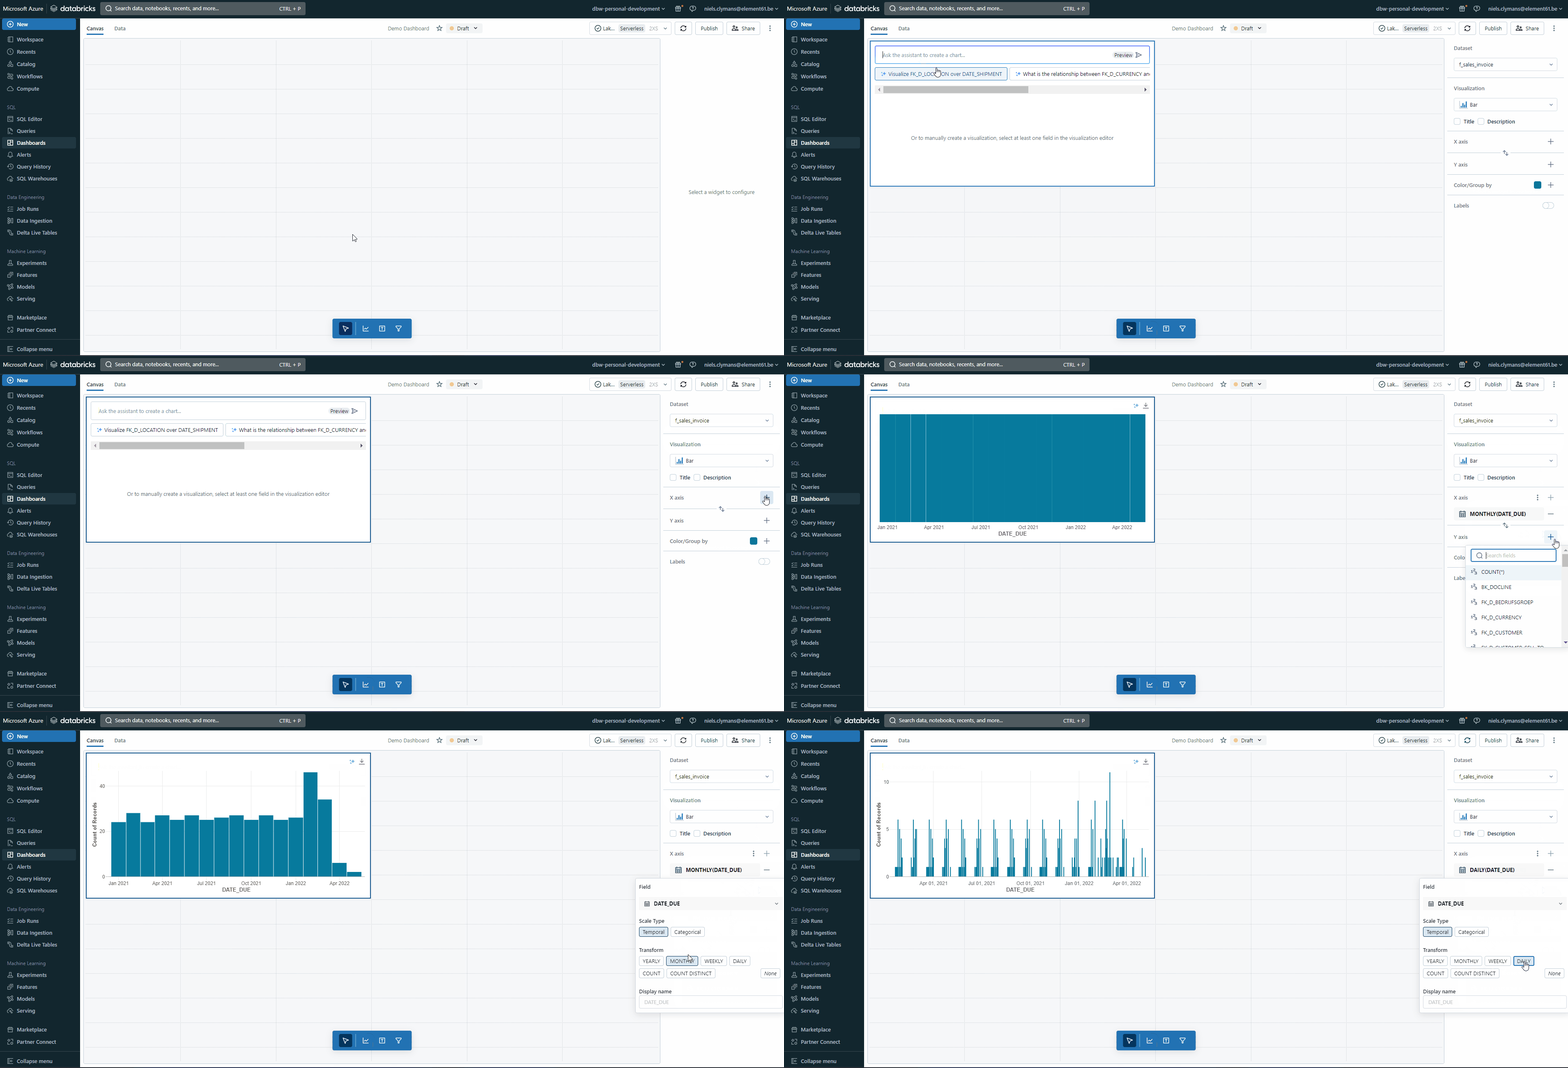
The canvas tab is where visualizations are created for the data selected in the data tab. In comparison with Databricks SQL dashboards, this has become more intuitive and more user-friendly. Visuals can be dragged in first, followed by selecting the data to be displayed in the visual. The number of possible visual types, however, has been reduced from 20 to 11. The 11 visual types in public preview are:
- Area
- Bar
- Combo
- Counter
- Heatmap
- Histogram
- Line
- Pie
- Pivot
- Scatter
- Table
Editing of the data displayed in the visual and possible aggregations of that data can be edited now with only one click, whereas a new screen for editing a specific visual needed to be opened each time in Databricks SQL dashboards. When a type is detected to be a date or timestamp, relevant aggregation possibilities are suggested, such as, for example, monthly and weekly summations. Visuals can also be created in natural language using the Databricks assistant. This feature, however, still behaves very unpredictably and should be improved upon by Databricks for the public release.

According to Databricks, the updated visuals should also render up to ten times faster than in Databricks SQL dashboards. This increase in performance goes together with optimizations such as visualization-specific filtering for large datasets.
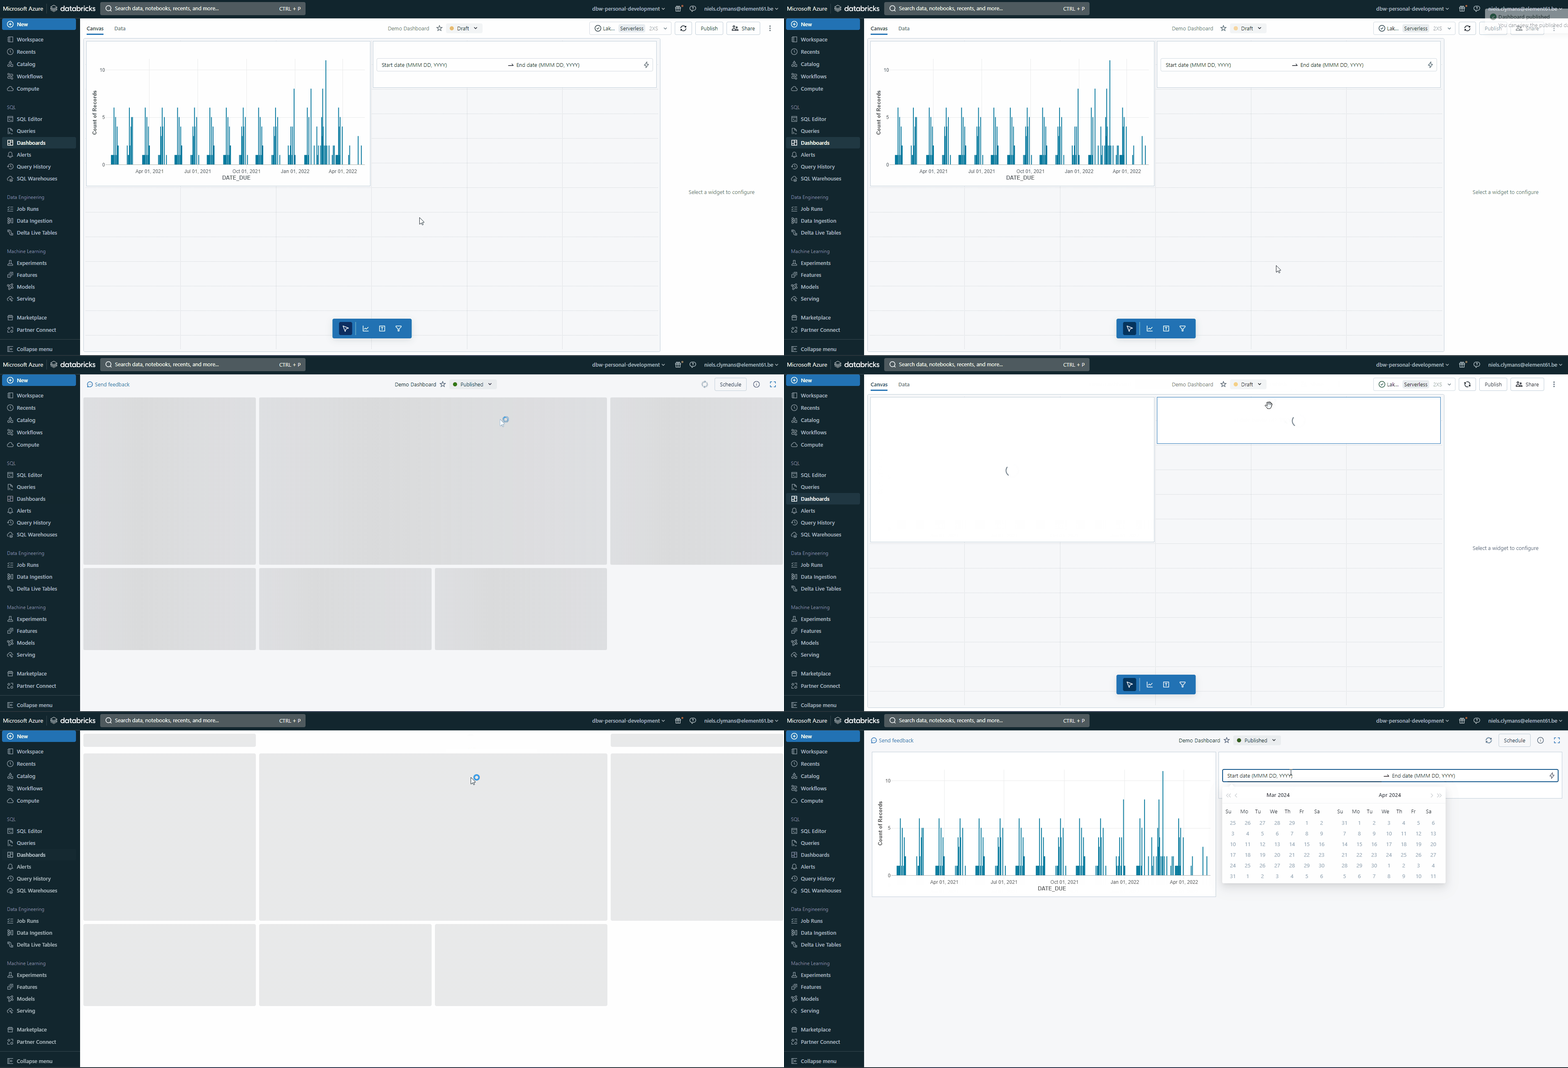
Next to visuals, also text boxes and slicers can be added. While the text boxes are similar to their counterparts in Databricks SQL dashboards, the slicers are improved upon by allowing them to be dragged in the canvas at any location and not just keeping them at the top of the dashboard similar to widgets, as was the case in Databricks SQL dashboards. Next to single and multiple value select, the filter types have been expanded with date picker, date range picker and text entry.

Sharing and collaboration: draft and publish mode
Another standout feature of Databricks Lakeview Dashboards is its sharing capability. Draft and publish modes facilitate collaboration without affecting live dashboards. Additionally, the option to embed or not embed credentials when sharing dashboards offers flexibility in how data is accessed and manipulated by different users.

While in draft mode the dashboard can be shared only with Databricks users in the same workspace, in publish mode they can be shared with Databricks users outside the workspace in which it is created and saved. When publishing the dashboard, the user has the possibility to embed their credentials and allow other users to access the underlying data and compute. When credentials are not embedded, all users opening the dashboard use their own credentials and need to have both access to the SQL warehouse and to the workspace. The possibility to embed credentials already existed in Databricks SQL dashboards, however.
Unification with the Lakehouse
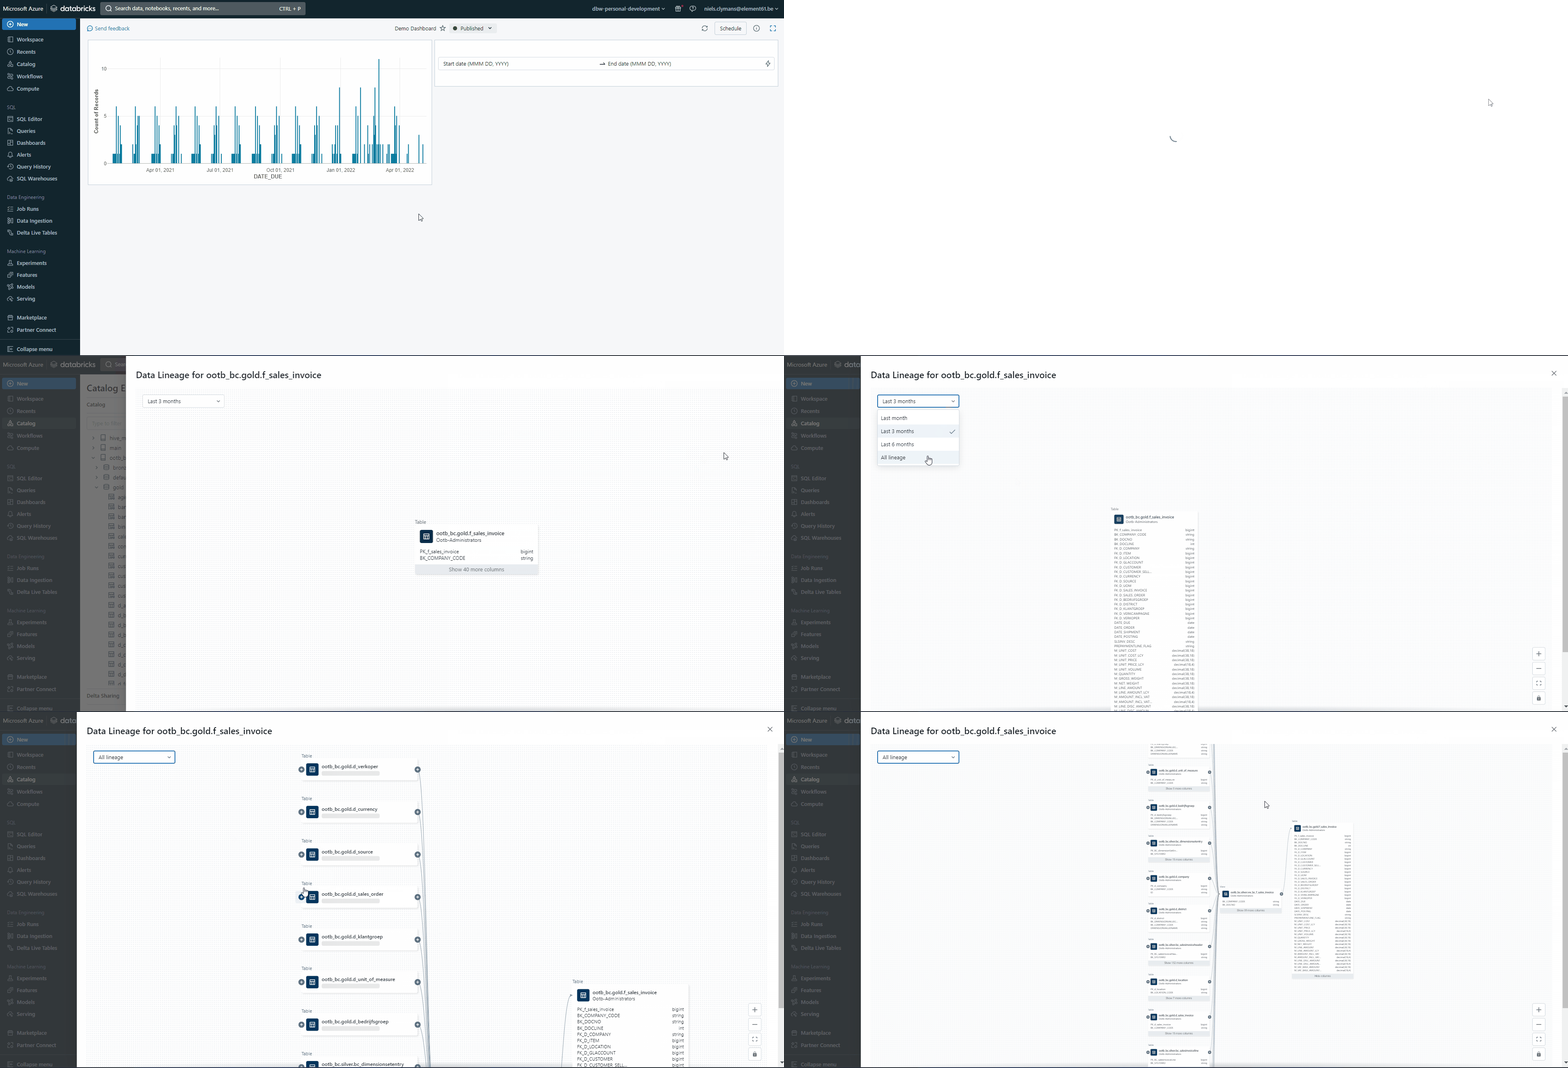
The great thing about Lakeview Dashboards is that they are created and edited within the platform where all data transformations happen. That way, all data is governed by the unity catalog and data lineage can easily be performed within the Databricks environment. Data lineage can be performed on the data used in published Lakeview dashboards by clicking on the info icon on the top right, clicking on the table of interest and then clicking on data lineage after being redirected to the catalog.

Other features
Other features of the Lakeview dashboards include, among others, access through REST API and subscriptions on published dashboards. Access of these dashboards using REST API might open opportunities for integrating these dashboards in CICD pipelines, if relevant at all. The subscriptions allow users to periodically get a PDF copy of the report sent to them through e-mail, as was the case with SQL dashboards. The frequency these copies of the report are sent out can be specified by each user individually. Each dashboard, however, has a limit of 100 subscribers.
Bottom line
Databricks Lakeview dashboards offer a more intuitive dashboarding experience but are definitely not (yet) a mature dashboarding tool on which companies can confidently build reports and dashboards, as is also not envisioned by Databricks. It still lacks some essential features, which might still be added in the future. For now, Databricks Lakeview dashboards have a place in teams of developers working in Databricks and could serve as a quick and dirty tool for gathering insights from data during development.


