Delivery Approaches
The first thing we need to decide is what the delivery approach of the project will be. The delivery approach dictates the way reports will be made available, and more important, who will be responsible for which part of the development. At its core, an approach will define where the responsibilities of IT stop, and those of business begin.
There are 3 approaches used for Power BI implementations.
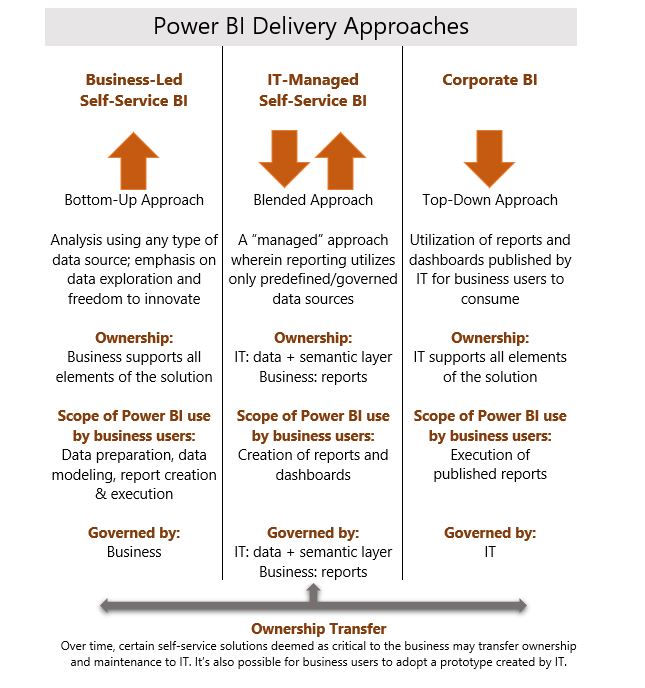
- Business-led Self-Service BI: This is the scenario were the business users have the most involvement and control. These kinds of setups typically incorporate many non-standardized, non-governed data sources. T
hough enterprise governed sources most likely will also be included, they aren’t the main source of data. The advantage of these kind of implementations is the flexibility and the ability to explore data outside the corporate data warehouse. The biggest impact is that the business units must take ownership and offer support for their data sources. As such, it requires qualified and technically capable business users to bring it to a good conclusion.
- IT-Managed Self-Service BI (Hybrid): In this scenario, business users use Power BI as a reporting layer on top of a controlled and standardized Corporate DWH. IT is responsible for the data up to the DWH or Semantic layer, and business owns the reports build on top of the data. The biggest advantage is that both layers can use their own release cycle. Because of this the report development cycle isn’t held back by the often slower database/data warehouse development cycle.
- Corporate BI: Also known as Enterprise reporting, these kinds of implementation are fully owned by IT. They are responsible for all layers, starting with the data and ending with the reports. Though very structured, and the most trustworthy of the implementations, it will have a slower development cycle and requires dedicated IT personnel.
As the above clearly shows, the chosen approach sets the level of business involvement. Which in turn will dictate the way the project needs to be governed.
It is important to realize that multiple approaches can be employed concurrently. Each project/report can have different requirements or user communities, requiring different approaches. Furthermore, it isn’t uncommon for project to change approach over time. The most common occurrence of this would be a Self-Service report becoming widely used and eventually considered business critical. At this point it would be best to switch it to a more managed approach.
The image below shows a nice overview of the 3 approaches and the impact on governance.
Do not make the mistake of automatically aligning large organisations with the corporate BI approach. The delivery approach that you select depends on the need and requirements of the project, not the size of the organisation.
Although it is certainly true that large corporations will most likely have a corporate data warehouse, that does not mean they don’t have a need for Self-Service BI. Using the same Governance approach for a Self-service project than you would for corporate BI will only lead to frustrations for both end-users and IT personnel.
Collaboration and Distribution
Once you have decided which approach you are going to use, we need to look at the different roles that the project will require. In every Power BI implementation, several roles are present. However, the person taking on those roles can vary.
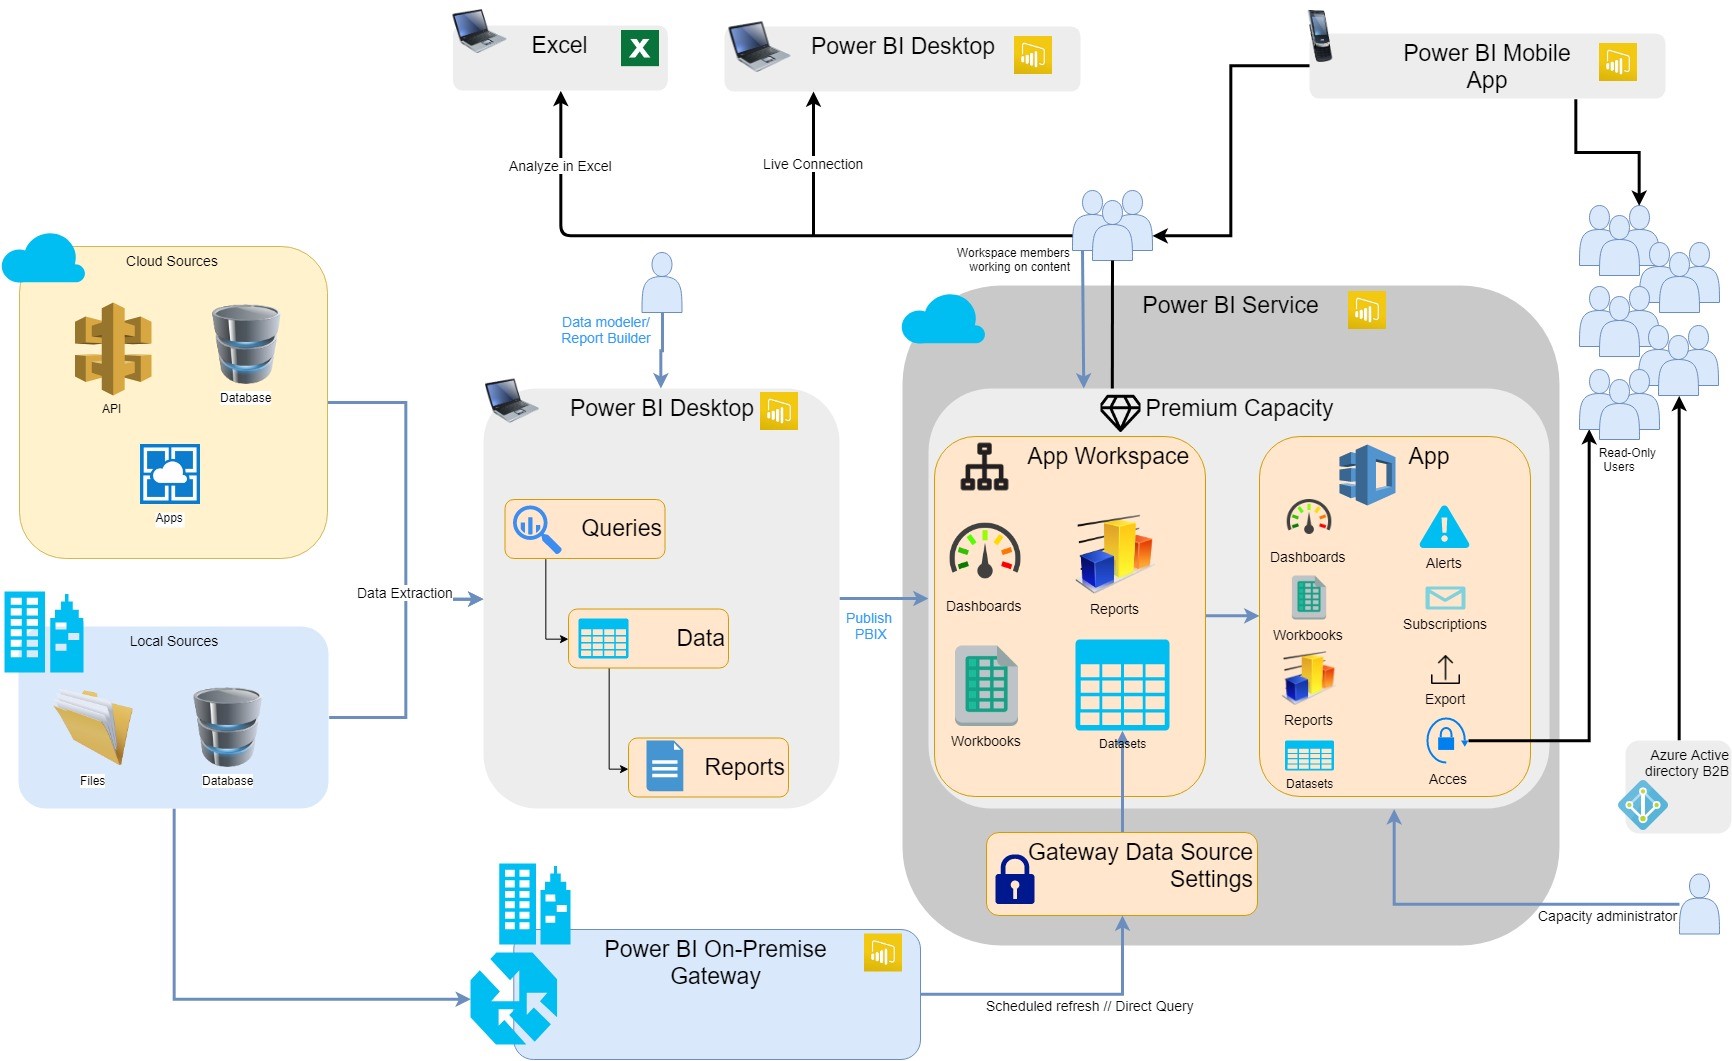
The schema below shows a full fledge large corporate design using Power BI Premium. This gives us a good starting point to list the roles we will need in a Power BI Implementation.
Data modeler: Gathers data from multiple sources and offers them in a clean modelled way.
Report designer: Builds the reports.
Workspace Admin: Manages a single workspace, and the users within that workspace.
Workspace User: Collaborates on the content within a single workspace.
Consumer: Read only user. Consumes reports as they are.
Capacity Admin: Manages the Premium capacity (only exists when using Power Bi Premium)
These roles that will be present in every Power BI implementation. The list is however far from complete. Depending on the needs of the company and the project, more roles should be added. It is however very important to make sure that every responsibility detected in the project is assigned a role.
Role Matrix
Now that we know which roles we need to assign and which approval level we want to offer, we can create a role matrix. The idea of the matrix is to map all roles identified during the previous step to either an employee or a group. We can then use this matrix to grant every user the correct access and permission in Power BI.
An example of a matrix could be:
|
Role |
Team |
Responsible |
|
Data modeler |
BI |
|
|
Report Designer |
BI |
|
|
Workspace Admin |
Finance |
|
|
Workspace User |
Finance, Buss. Analysts |
|
|
Consumer |
Finance, Management |
|
|
Capacity Admin |
IT |
|
|
Executive sponsor |
Management |
|
|
IT Infrastructure responsible |
IT |
|
Security
Once we have determined who should be able to do what, we can start to implement it. When it comes to Power BI, we can set security on multiple levels.
Workspaces
A workspace is a virtual place where users can collaborate with colleagues around a specific topic. You are free to choose how you split up workspaces, but typically it will be a project, or a logical entity. A “Sales” workspace for all people working around sales data would be a good example. Power BI admins can use the Admin portal to grant users permission to create workspaces.
The idea of a workspace is that users can use it to work together on their project, and once finished, publish the workspace as an app, making it available to a larger audience.
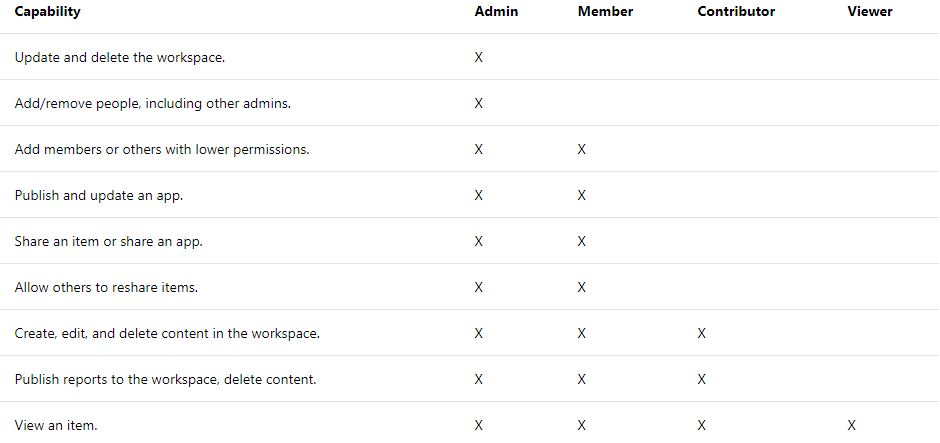
Workspaces work with four roles:
It is important to closely guard who is given Admin or Member rights, as they can publish and share apps and reports. They have the responsibility to make sure they don’t leak sensitive data. The default role for someone joining a workspace should be contributor, and not member. I believe Microsoft made a mistake by calling this role “Member”, as it doesn’t emphasise the capabilities of this role.
From a licensing point of view, it is important to note that everyone that you add to a workspace needs a Power BI Pro license.
Apps
When a team working in a workspace wants to share dashboards or reports with a broader audience, they can publish their dashboard as an app. This can be done to share with either a group, your entire organization or even someone outside the organization.
Apps by themselves aren’t a layer on which security can be applied. But we mention them here so that you are aware what users within workspaces with the permission to publish apps can do.
For your users to view your app, either they need to have a Power BI Pro license, too, or the app needs to be stored in a Power BI Premium capacity.
Row-Level security (RLS)
Row-level security can be used to restrict data access for given users. Thus, restricting data to users, without restricting access to a report. Instead of an all or nothing security, RLS is using a filter approach. Only showing the user the data that he/she has access to, while filtering everything else.
A common example of this is a sales report that can be used by all sales persons, but only shows each person his own sales, while filtering the sales of all his/her colleagues.
Authentication
Power BI uses Azure AD to do user authentication. This gives you access to the entire AAD suite.
Some of the most interesting features are:
Multi factor authentication: Easy MFA integration greatly increases the security of your authentication process.
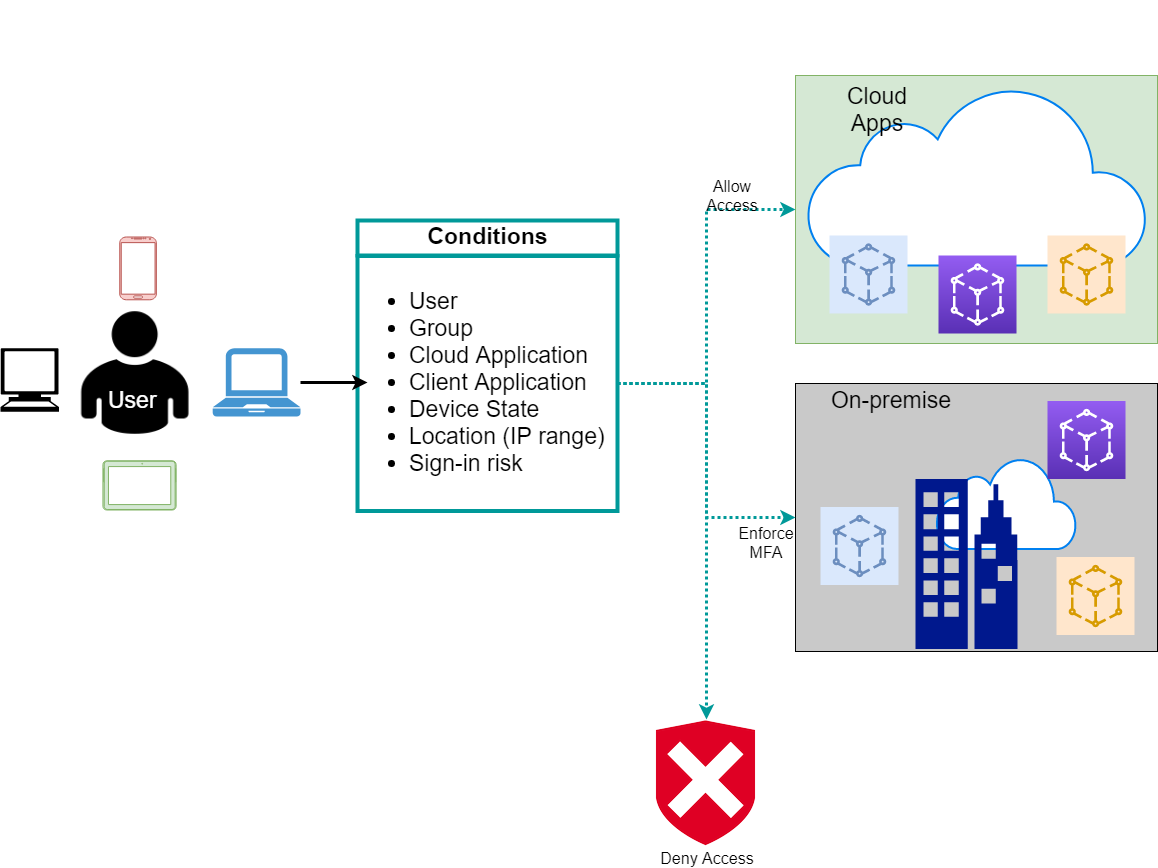
AAD Conditional Access: Allows us to set up all sort of complex authentication rules/exceptions. As seen in the image above, the conditions are quite varied.
- User/Group: Default identity-based authentication
- Cloud application: rules based on the application, for example a rule specific for Power BI
- Device state: rules based on the device that sends the request, for example a rule for android devices
- Location: Based on IP. A rule only for devices inside the corporate network
- Sign-in risk: Microsoft uses machine learning to tag certain locations (geo) and networks (IP) as sign-in risks
Using these conditions together allows you to create a lot of complex rules. A good example would be a rule to only allow users with android devices to connect to Power bi if they are connected to the corporate network.
Mobile device app management: Using Intune for Power BI mobile apps, we can take governance over the mobile devices using Power BI. Giving us the ability to for example:
- Force users to use a pin code when accessing Power BI on their phone
- Wipe our corporate data from the phone if it gets stolen
Power BI Tenant settings
When it comes to security and compliance settings Power BI offers a wide variety of settings on Tenant level. In the table below, we have summarized the most important ones related to governance.
All these settings can either be set on the Organizational (ORG) level or on individual Security Groups (SG). A neat feature when setting them on SG level, is that we can use an except clause.
For example, let’s say you have a Security Group containing all your “HR personnel”. And you have a Security Group containing all people working through an internship. You could then grant “publish to web” rights to everyone in the “HR group”, except for those who are also part of the “Internship group”.
|
Setting |
Description |
Level |
|
Create Workspaces |
Users in the organization can create app workspaces to collaborate on dashboards, reports, and other content. |
ORG, SG |
|
Use datasets across workspaces |
Users in the organization can use datasets across workspaces if they have the required Build permission. |
ORG, SG |
|
Share content with external users |
Users in the organization can share dashboards and reports with users outside the organization. |
ORG, SG |
|
Publish to web |
Users in your organization can publish reports viewable by anyone on the web. Authentication is not available when viewing reports using Publish to web. |
ORG, SG |
|
Export data |
Users in the organization can export data from a tile or visualization. This also controls the Analyze in Excel and Power BI Service Live Connect features. |
ORG, SG |
|
Export Reports as PPT or PDF |
Users in the organization can export Power BI reports as PowerPoint files or PDF documents. |
ORG, SG |
|
Print Reports and dashboards |
Users in the organization can print dashboards and reports. |
ORG, SG |
|
Certification |
Allow users in this org to certify datasets. |
ORG, SG |
|
Allow external users to edit or manage content |
The specified guest users in the organization can edit and manage content in workspaces in the organization. They receive the ability to browse content and request access to content. |
ORG, SG |
|
Email subscriptions |
Users in the organization can create email subscriptions |
ORG, SG |
|
Publish apps to the entire organisation |
Users in the organization can publish apps to the entire organization. |
ORG, SG |
|
Create Template Apps |
Users in the organization can create template apps that use datasets built on one data source in Power BI Desktop. |
ORG, SG |
|
Push Apps |
Users can share apps directly with end users without requiring installation from AppSource. |
ORG, SG |
|
Use analyze in excel with on-premise datasets |
Users in the organization can use Excel to view and interact with on-premises Power BI datasets. |
ORG, SG |
|
Use global search for PowerBI |
preview setting |
ORG |
|
Add and use custom visuals |
Users in the organization can add, view, share, and interact with custom visuals in the Power BI service.? |
ORG, SG |
|
Allow only certified visuals |
Users in the organization who have been granted permission to add and use custom visuals will only be able to use certified custom visuals. |
ORG |
|
Interact with and share R visuals |
Users in the organization can interact with and share visuals created with R scripts. |
ORG |
|
Data classification for dashboards |
Users in the organization can tag dashboards with classifications indicating dashboard security levels. |
ORG |
|
Embed content in apps |
Users in the organization can embed Power BI dashboards and reports in SaaS applications. |
ORG, SG |
|
Allow service principals to use Power BI APIs |
Web apps registered in Azure Active Directory (Azure AD) will use an assigned service principal to access Power BI APIs without a signed in user. To allow an app to use service principal authentication its service principal must be included in an allowed security group. |
ORG, SG |
|
Publish template apps |
Users in the organization can create template app workspaces to develop app solutions for distribution to clients outside of the organization. |
ORG, SG |
|
Install template apps |
Users in the organization can install template apps created outside of the organization. |
ORG, SG |
|
Install template apps not listed in AppSource |
Users in the organization who have been granted permission to install template apps which were not published to Microsoft AppSource. |
ORG, SG |
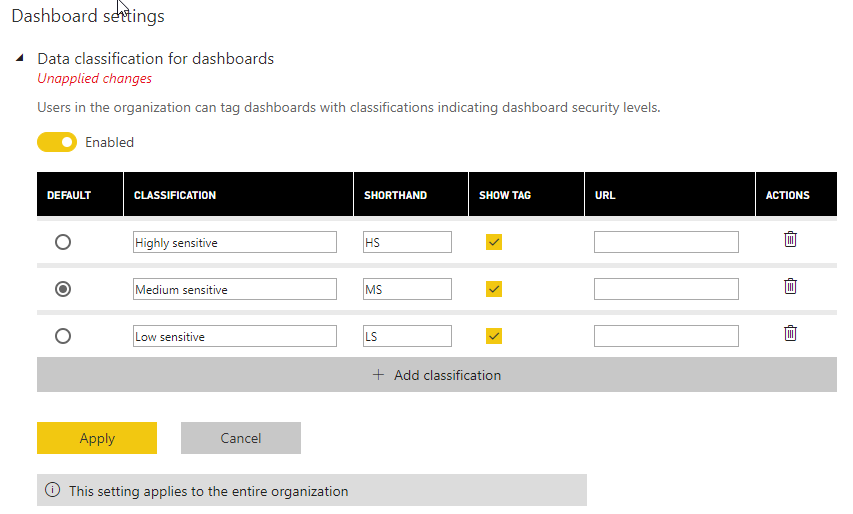
Dashboard Classification
Although all settings above are important and should be considered carefully, there is one we would like to point out specifically. Dashboard classification is a feature that allows you to add a classification Tag to your dashboards. It is meant to add the level of sensitivity of the data in the dashboard. This will make your consumers more aware of the sensitivity of the data that they are using. Furthermore, by setting these tags to dashboard you are reminding yourself of the importance of setting the correct security on the data used in the report.
You are free to set the descriptions of the tags yourself to suit your business needs. You’re even able to choose which classification you want to be the default value.
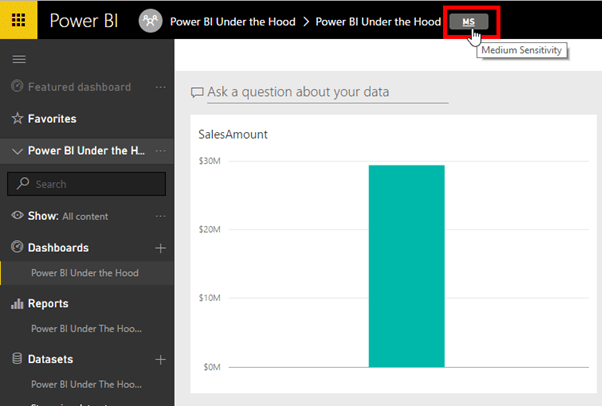
In the example below, you can see that the dashboard is tagged as being of Medium Sensitivity.
Monitoring
For the final part of this document, we will look at monitoring the usage of Power BI. Accountability and Participation are two major principles of governance. With the correct monitoring, we can fulfil the need for one, and measure the second. Luckily Power BI has just the tools for us.
Audit log
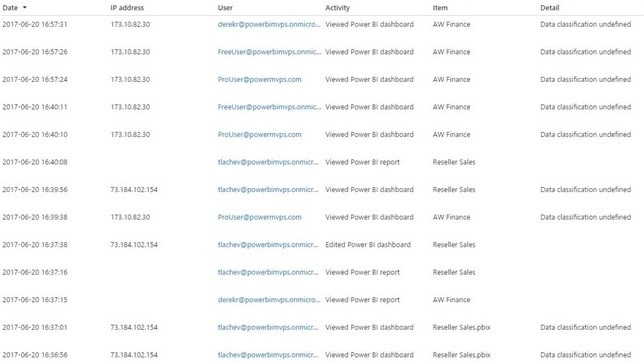
The Power BI audit log gives us a lot of information about the usage of our Reports/Dashboards. It logs all connections and actions on our Power BI tenant. It provides answers to following questions:
- When was a report accessed ?
- How often was the report accessed ?
- Who accessed the report ?
- How did he consume the report ? View, update, print, share, publish…
With new data regulations, this kind of logging becomes more and more important. Being able to list all users who have exported data from Power BI for example is very interesting for companies working on GDPR compliance. The audit log gives us a great way to support the accountability of our data usage by logging who is doing what with the data.
You can find the audit log in the admin portal. It is actually an O365 feature, and so upon opening it, you will be taken to the O365 Security & Compliance portal.
For a more detailed overview of the audit log you can use this document by Microsoft: Audit and usage tenant settings.
Usage Metrics
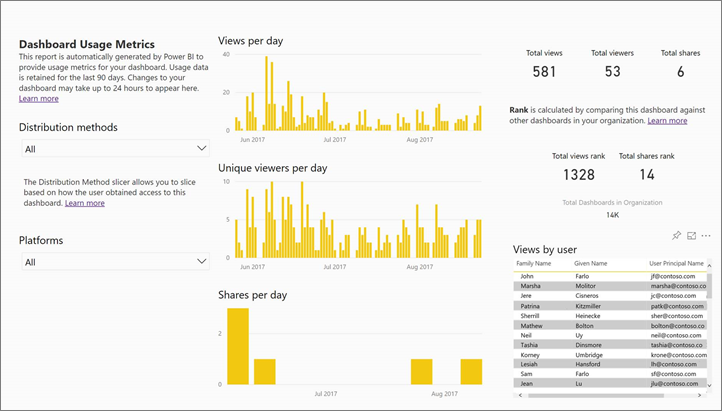
When it comes to measuring participation, we can use the Usage Metrics inside the Power BI Admin Portal. It gives us a great overview of participation rate of our users.
If you find a team that isn’t using their reports, you will need to investigate what is wrong. Often the cause is one of the following:
- Awareness: they don’t know the reports exists
- Skill: they don’t feel comfortable with Power BI and might require additional training
- Discord: the reports don’t give them the data they need
- Trust: they don’t trust the data in Power BI
Once you know what the issue is, you can work on solving the problem.
