The new face of IBM's legendary TM1 planning and analysis platform
IBM Planning Analytics, also known as TM1 10.3, integrates business planning, performance measurement, and operational data to enable companies to optimize business effectiveness and customer interaction regardless of geography or structure. Planning Analytics provides immediate visibility into data, accountability within a collaborative process, and a consistent view of information, allowing managers to quickly stabilize operational fluctuations and take advantage of new opportunities.
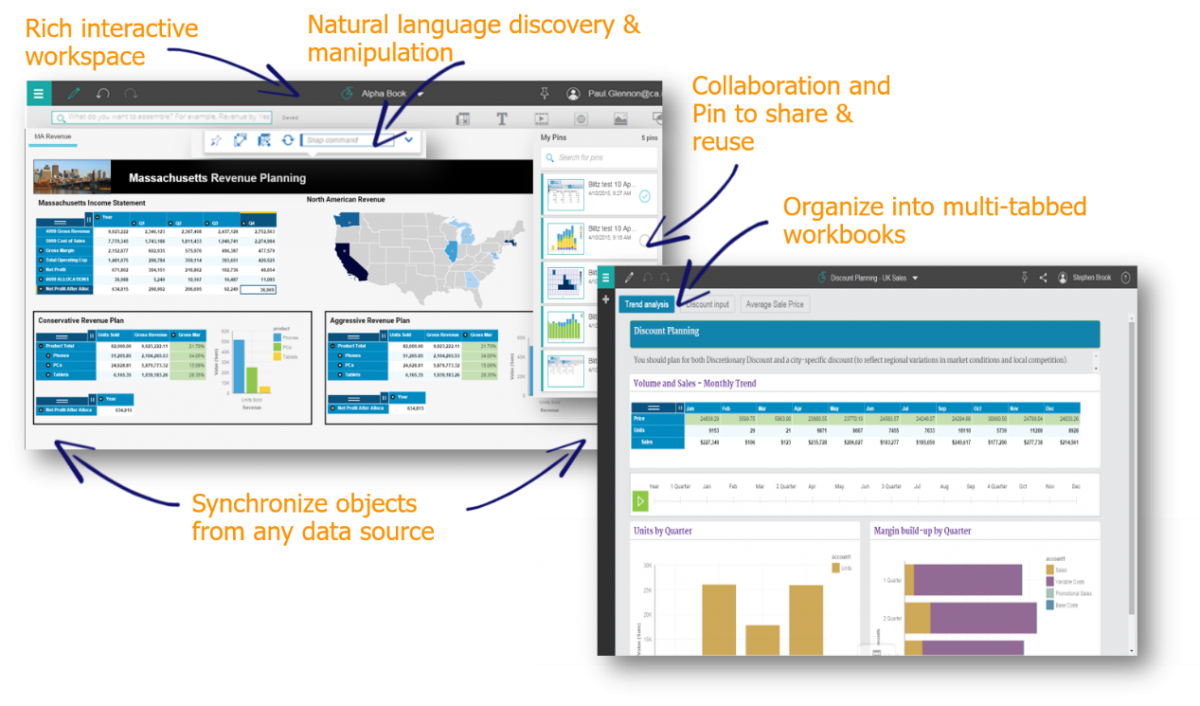
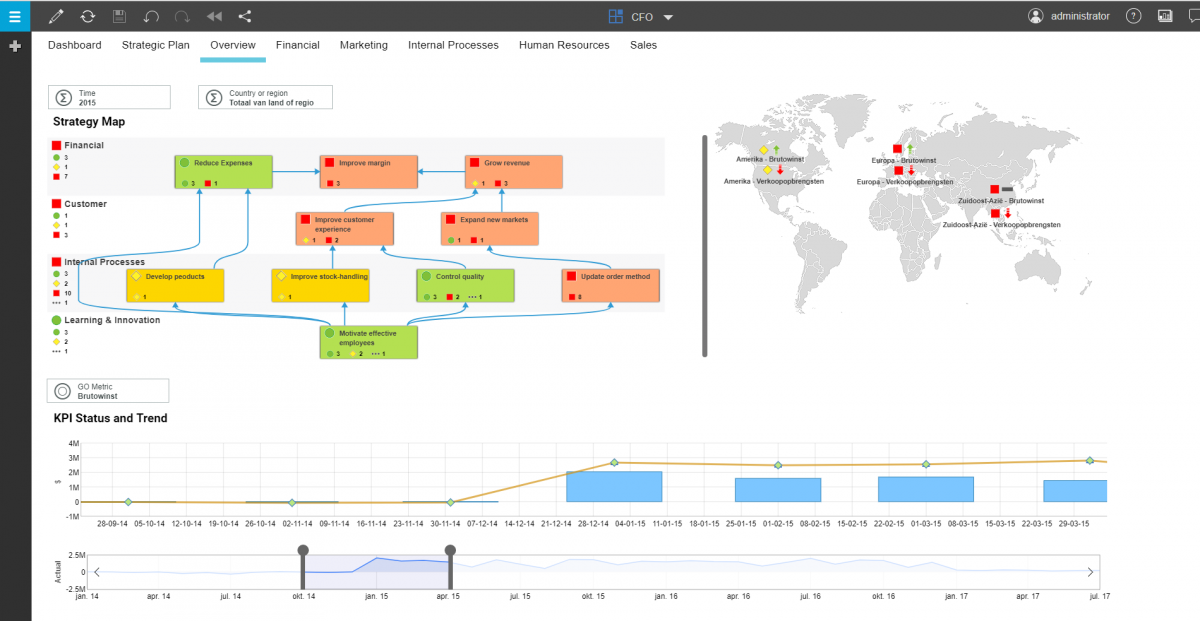
With Planning Analytics comes Planning Analytics Workspace, or PAW for short, will be the new face of IBM’s TM1 planning and analysis platform. It will open up the world of advanced analytics to all business users. It brings a whole new front end to the TM1 platform.
Following main functionalities come with it:
- A rich, interactive user interface where you can easily build analytical and planning applications or dashboards by combining cube views, web sheets, scorecards, and data visualizations
- Easy synchronization between different objects (cube views, web sheets etc.)
- A data discovery interface with natural language processing and collaborative features such as an online chat.
Figure 1
PAW is now available to on premise customers as well as cloud based ones. It does require an additional add-on license. The reason for this insight is giving you an overview what Planning Analytics Workspace can mean for you. TM1 is changing towards PAW and ending support for previous versions so it might be use full to read along.
Technology & Upgrading
Architecture
Planning analytics has a pretty straight forward architecture.
- Tier 1, being the front end layer, is were Planning Analytics Workspace places itself, next to TM1Web and PAx(Planning Analytics for Excel).
- Tier 2, the webApplication Servers Layer, will only be used for the web interfaces (PAW and TM1Web)
- Tier 3, being the data layer, holds the engine, the tm1 server and the admin server.
Tech and installing
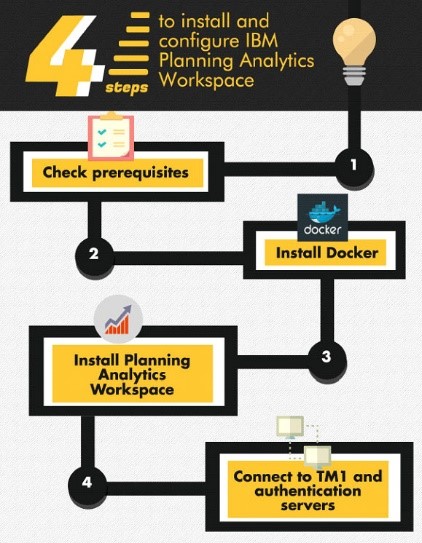
First you will need Planning Analytics 2.0 local installed and configured on your machine. As PAW will connect to this.
PAW is running on Docker, which is a container platform that eliminates the “works on my machine” problems. In order to be able to run it, you need to have a machine that support virtualization and has the docker environment installed on it. You can install it on both Linux and Microsoft OS running machines. As long as they support virtualization you are good to go!
When using Azure cloud services this is a different story, Docker is not supported inside a virtualized environment, so in order to make this work, you need to have an Linux machine running aside your Azure environment running Planning Analytics.
Figure 3
Upgrading
Upgrading your current version of TM1, assuming you have a version < 10.3, is fairly easy. It’s the same as a normal TM1 installation. You just need to upgrade your current installation with TM1 10.3 (Planning Analytics 2.0 local) and you are good to go. Be warned, any custom configuration you have done, might be affected. Make sure you have your old environment backed up before you start this process. To upgrade Planning Aanlytics Workspace, you need to redo the images it uses in docker, your configuration settings will stay the same.
Overview of the technical functionalities
What can you do?
Create books
You can create books with different sheets, and use different templates on each sheet. You can customize the formatting and layout of your books and sheets by adding logos, and applying formats and text styles.
Add TM1 content
You can add content that is created in other TM1 applications, such as views and websheets. A websheet is a Microsoft Excel workbook with TM1 data that you can view in a web browser (cfr. Perspectives/Pax).
Create views
You can create views in Planning Analytics Workspace by using sample data or your own data. You can also create sets from dimensions to limit the number of members that are seen. Power users can use MDX expressions to create subsets.
Enter data
You can enter data by typing in editable cells. You can also use data-spreading shortcuts to speed up the data entry process.
Add visualizations (graphs)
You can create a number of different graphs from your data views. For example, you can create bar charts, heat maps, and scatter plots.
Analyze data
You can analyze data in views in a number of ways, such as by slicing and dicing the data to change context, by nesting dimensions, and by sorting and filtering on dimensions.
Work in sandboxes
Search for data by using natural language in the intent bar
You can search for data by using natural language capabilities.Save views and visualizations for easy retrieval in Collections
Use snap commands to perform tasks
Snap commands are simple commands that you can use to perform tasks.
Work in websheets
You can add websheets to books, and have websheets and views on the same sheet.
Modeling
The ability to do on the fly modeling in your model, more on that later in this insight.
What can’t you do
Undo and redo
Undo and redo do not apply to data entry actions. They apply only to changes that you make to the canvas and to the configuration of views.
Cell coloring
There is no cell coloring to indicate transient data entry (that is, data that is not yet committed).
Color formatting
Color formatting is limited, for example you can’t change a grid color in a report view.
Dashboards and/or interactive reports
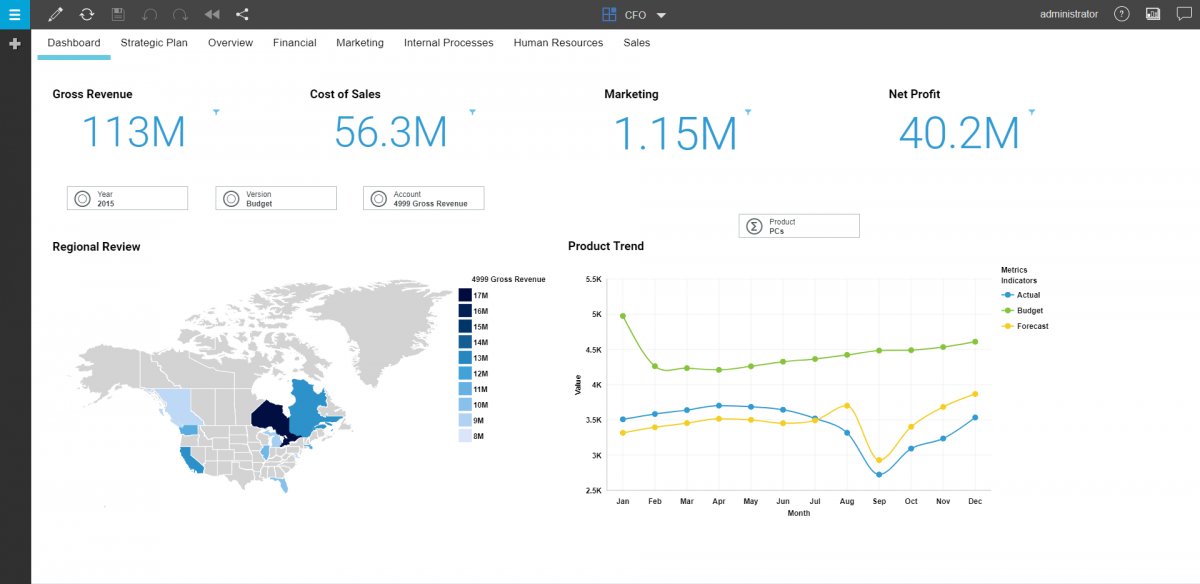
The main purpose of PAW is delivering a front end solution to business users. It focuses a lot on creating visual appealing reports/dashboards, which are interactive and can provide you with fast insights.
To start off you will need a book, this book will contain your data, the way you build it will determine if it is a dashboard, a interactive report, a view or a websheet.
A Planning Analytics Workspace Book can be created in 3 different types:
- Single page
This will use one page to display all your data
- Tabbed
You can create separate tabs for different categories of information. For example, you can create separate tabs for sales by country, by region, and by total sales.
You can choose from the following templates:
o Freeform
The Freeform template is one large area that is not divided into sections. Objects in this template can be positioned wherever you want, and they keep their size and position regardless of the screen size.
o Other templates
A number of defined templates that divide the sheet into separate sections are available. This kind of template uses relative positioning. Images adjust their size and position to fit the space they are added to, but views don't change.
Once you have decided which kind of book you want to create, it is time to fill it up with useful data. Be sure that you are in edit mode to do this, when you are in this mode you are able to add new content, move and resize it, renaming content, add new sheets, … .
You can drag and drop existing views from the left data pane.
You can also create a new view by selecting the “New view” icon in the top right corner of your workspace.
Other content options there are:
- Adding navigation buttons, these can be used to go to different tabs or even different books
- Adding Text boxes
- Adding media such as movies, websites and images
- Adding shapes
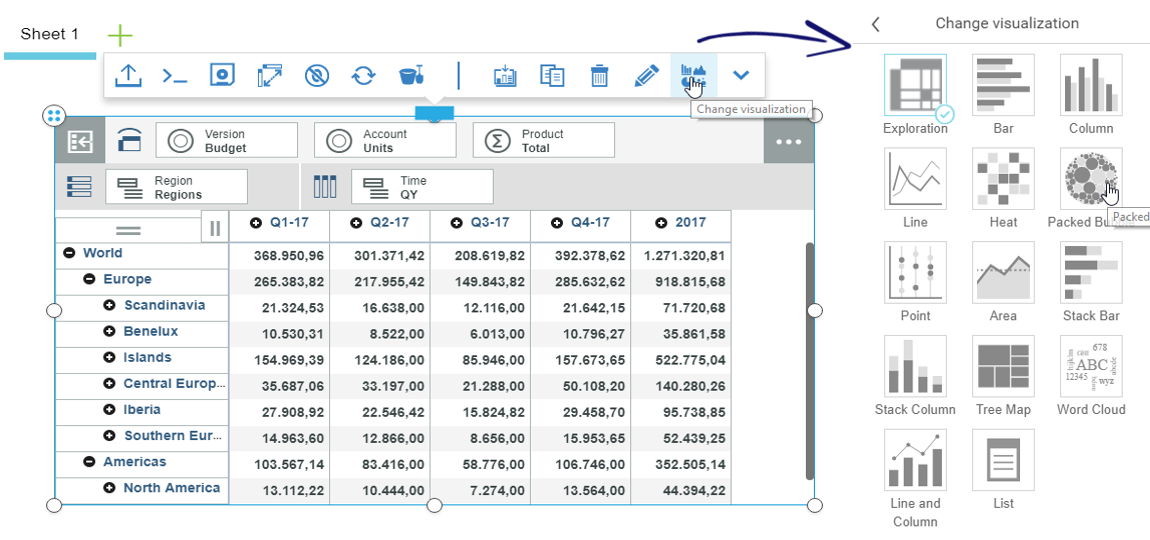
Once you have created a view, you can reform this into a graph. This is always based on a view, and can be easily achieved by changing the views visualization.
This option will then pop up a numerous of available graphics, you can then select the one that is suited the best for your view.
Once you have your different views in your book, you can start adding the interactive part. You can add selectors based on dimensions that are used for a certain view or even for multiple views. Once added you can change the synchronization settings for each view to be influenced by the selector or not. For example you can show one view with the total of Europe, but want to change another view with a detailed country.
The possibilities are endless, and the only limit is your creativity.
Security
PAW uses the security settings you made in the TM1 model behind, so security on elements, dimensions, views, applications, cubes, … is all in sync inside PAW.
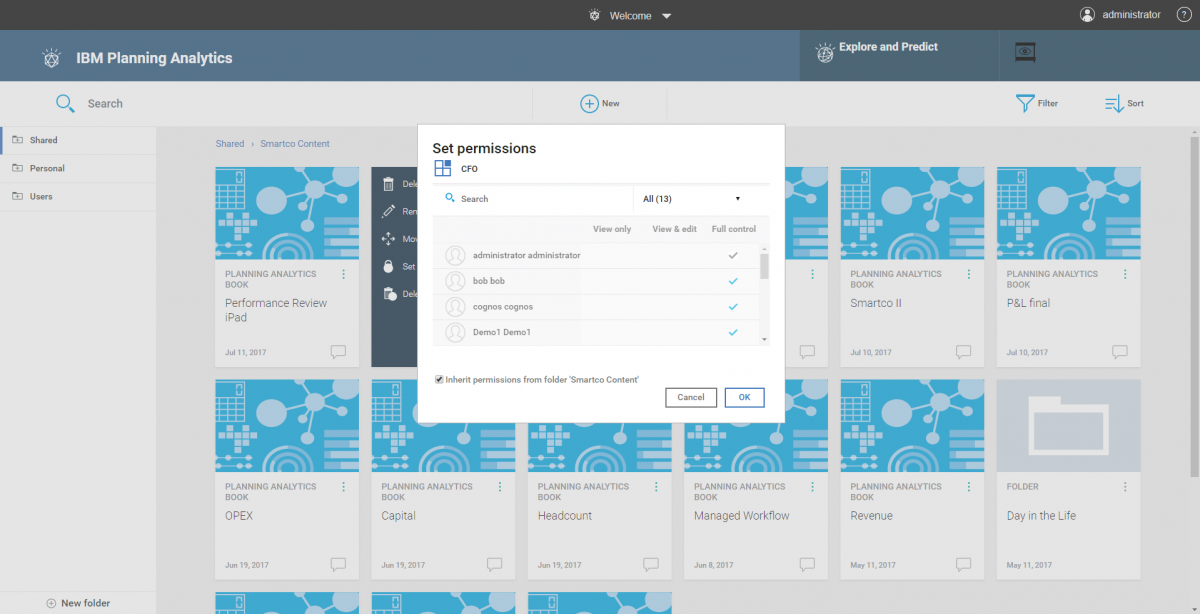
Security on the books and folders located in PAW is something you have to configure inside PAW itself. You have the option to set premisions to each book, view, websheet and folder created in PAW.
Important to know is that security is set on user level and not on user group level, so the administration maintenance can become a struggle in larger organisations.
Modeling in PAW
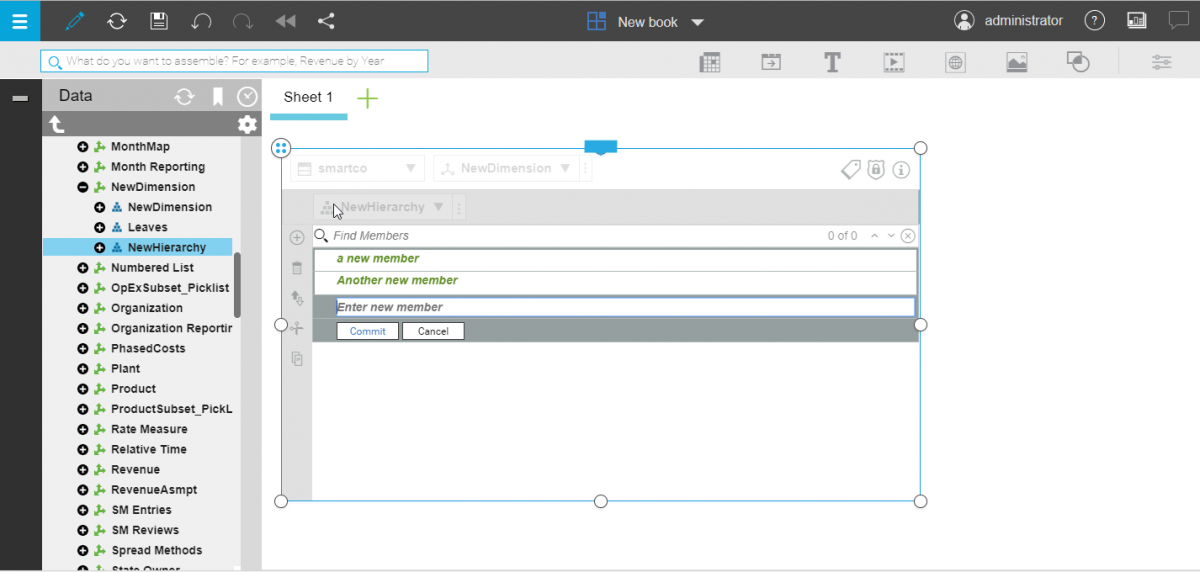
A very nice feature in this new front end, is the ability to do on the fly modeling by using PAW. Having the correct rights, you can use Planning Analytics Workspace to model user data with cubes, dimensions, hierarchies, attributes, and security.
It is important to know that any changes you make in your model have an effect to the entire model, and thus for every user using the model.
Also this feature does not replace TM1 Architect and the possibilities there, it is still very much advised to use Architect for modelling purposes.
Dimensions
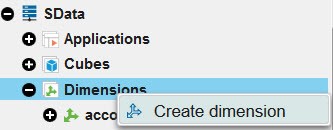
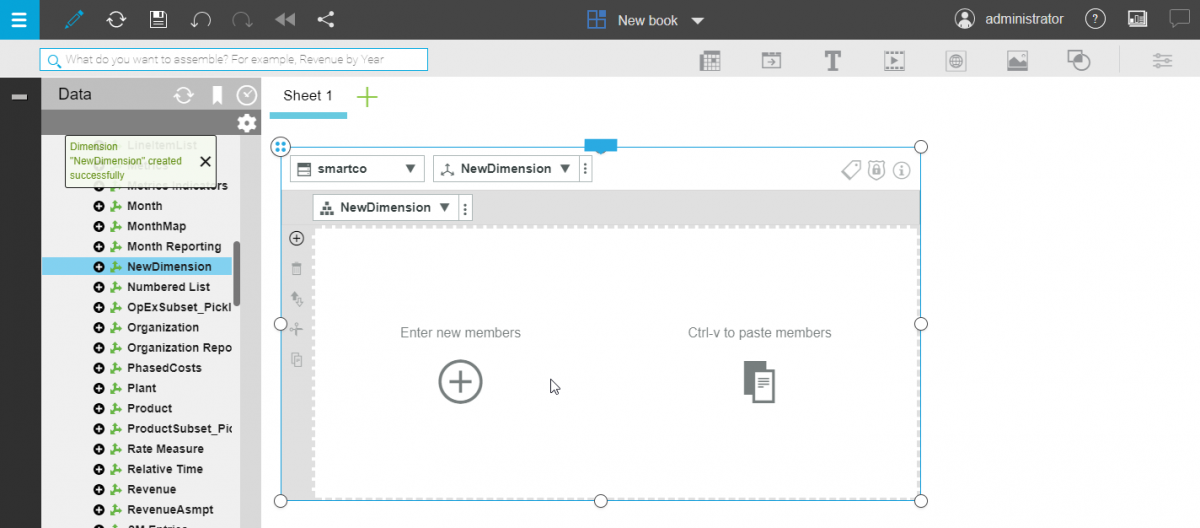
You can create dimensions, adding members and attributes for those members. The dimension is the starting point for what could be a complex system that models your data.
Figure 8
By default, a dimension is created with a hierarchy that has the same name as the dimension. All dimensions must have at least one hierarchy.
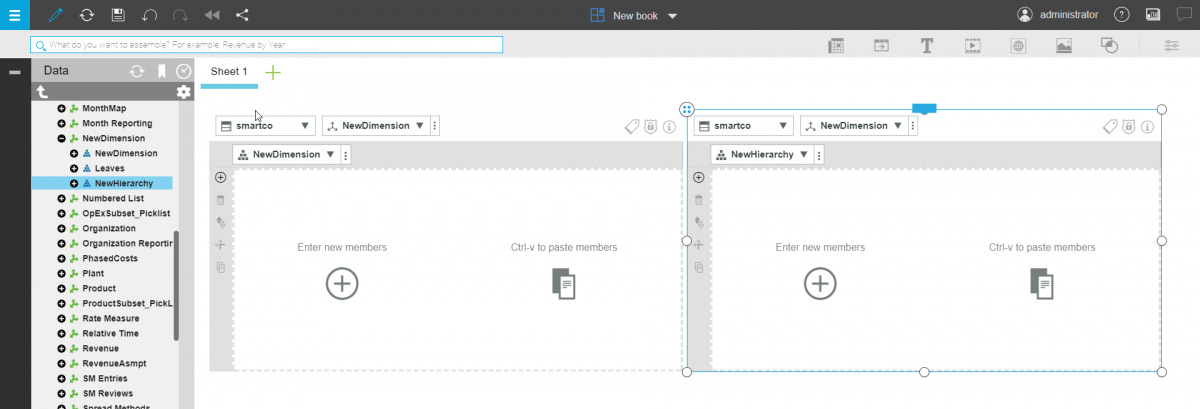
Once created you can easily add new members and create multiple hierarchies inside this dimension (cfr. Hierarchies subject).
Hierarchies
You can use hierarchies in dimensions to see alternate rollups of the data in the same view. For example, you could have a hierarchy that shows an organization rolled up by region, and a hierarchy that shows an organization rolled up by vice-president.
You can also create hierarchies of member attributes such as color, size, and type. You can use these hierarchies for filtering and analysis.
You can have more than just one hierarchy in a dimension. Think of a dimension as a container of hierarchies, not just as a container of members. The hierarchies are the containers of members and the dimension is a container of those hierarchies. That’s a lot of containers! Hierarchies are just a different way of slicing your data. Now, you can slice it any way you want.
Every dimension starts with one default hierarchy and that’s always named the same as the dimension.
In PAW you have the following options available:
- Create hierarchies within dimensions
- Edit hierarchies, including cut, copy, or paste to and from Microsoft Excel or a text editor
- Delete hierarchies
- Edit the properties of a hierarchy
Members and attributes
You can use the Dimension Editor to add, delete, cut, paste, copy, move, and sort members in a hierarchy. The member action toolbar, on the left side of the Dimension Editor, provides quick and easy icons to add, delete, sort, cut, copy, and paste members. You can also right-click a member and cut, copy, add, delete, keep, hide, show, sort, or move members.
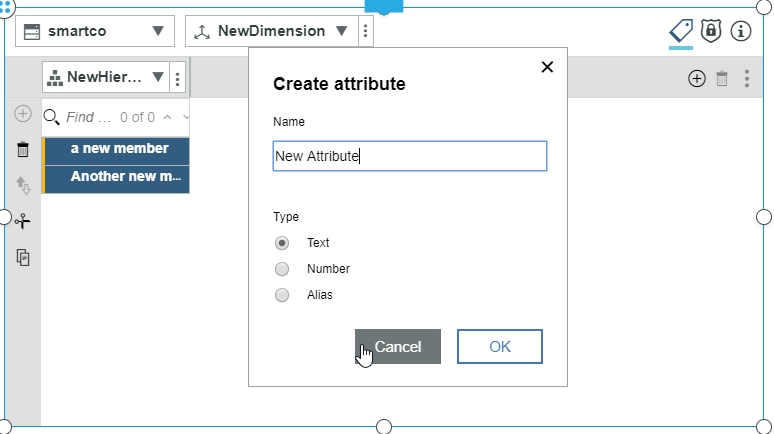
Attributes help to explain or describe a member in a dimension. You can use the information panel to change member attributes and hierarchy properties.
Security
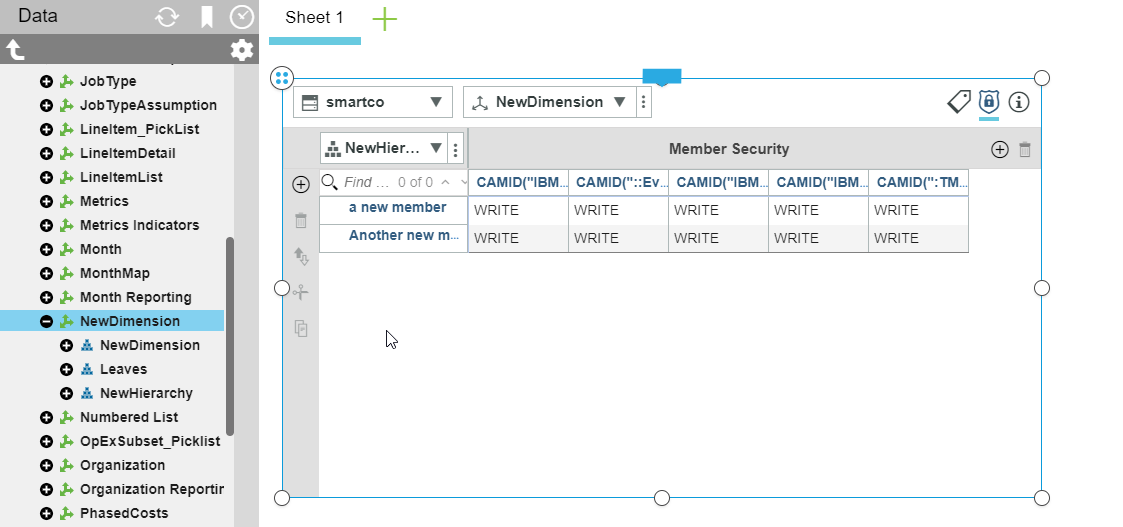
You can use the security view in the Dimension Editor to create and manage member security. Planning Analytics Workspace creates certain user groups by default. These groups include the ADMIN, SecurityAdmin, and DataAdmin user groups.
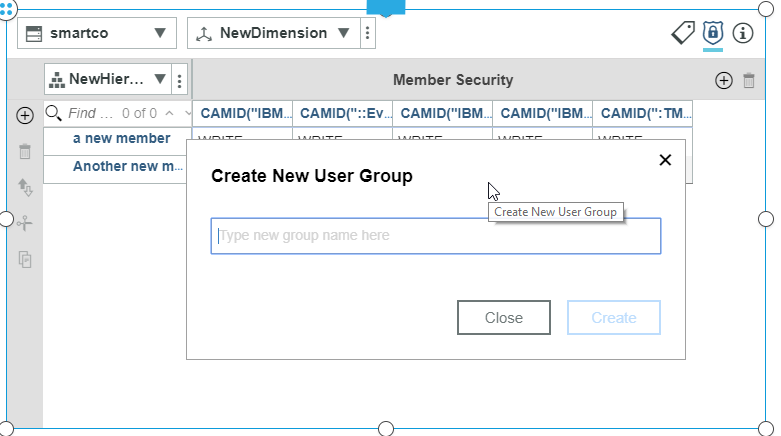
You can assign the security for that dimension or cube inside PAW, also possible is the ability to add a new user group to the existing security user groups.
PAW vs TM1 Web
Many of you working with existing TM1 solutions will have been in touch with TM1Web. So it is important to go over this topic as well, since it looks like PAW is poaching on the TM1Web territory. But don’t be alarmed, they’re a different product, and thus have a different user public, meaning it is advised to use them next to each other and not replace one another with it.
TM1Web is made for business users, financial controllers, planners, … people that will really do intensive input in the budgeting, planning or forecasting process. It is safe to say that TM1Web has stayed the same in planning analytics, it has even become better. They threw a new look and feel in (strong resemblenaces to Cognos Analytics 11) and the speed is fantastic.
The typical use of TM1Web is when perspectives, the TM1 add in for Excel, starts to be slow. Because of architectural reasons, a perspectives file can become slow, a solution for this, is going to TM1Web to open your websheets (uploaded perspectives/Excel files).
TM1Web focuses to show one thing at a time, this meaning if you use views, you will not be able to combine data from different sources on one page. So unlike PAW, where you can combine different views/web sheets in one screen. The main functionality of TM1Web is the same as in previous versions, just cleaner and fresher. On the contrary, to TM1Web, PAW will focus more on a business analyst, CFO, finance managers, … type of people. While it does provide the same capabilities and options that TM1Web offers, it is just not the same.
PAW is made to build dashboards/interactive reports where you can combine different views of cubes on one sheet, and you can even throw in a web sheet as well. You can add filters to it and when it is a common dimension, it will be interactive to all the cubes using that dimension.
Meaning that PAW will be less used as an input/planning/budgeting/forecasting environment, at least for now…. This because of the way parts are shown in a book, they’re a bit bulky making moving around sometimes difficult when you want to input large amounts of data. A solution for this is working with web sheets inside books, these can be altered easier.
Conclusion
Planning Analytics Workspace brings a new and fresh approach in the Planning Analaytics world, TM1 has been long on the market and besides the numerous architectural updates, it stayed conservative in terms of visualizing the data. Bringing PAW into the game is something different and fresh.
You can combine different solutions, you can still use TM1Web, Pax or perspectives for your writers and you can use PAW purely as a front end tool to provide managers, CFO’s, analysts a platform where they can use the interactive reports and dashboards to do their analysis. The user interface allows you to create rapid reports and interesting analyses with a jiff of the finger.
Why should you upgrade?
You should upgrade to planning analytics 2.0, this does not mean you will have PAW in this release, that will depend on your license. But it is worth to go for the upgrade, since Planning Analytics 2.0 itself brings a better and improved TM1 experience.
Also a nice feature is that your TM1Web will undergo a complete visual make over, which can maybe prepare you for PAW, as it uses the same kind of theme.
Should you then go for the extra license?
It depends, if you have an organization where your business users are plenty and they are in need of a quick report, analysis platform on TM1 data, then yes, you should consider getting PAW. When used correctly, this can be a very good product and will for sure make the life of a business analyst a lot easier.
IBM is on top of its game and plans to release versions more quicker than before, meaning that any flaws or improvements will show up really fast. So it’s time to jump on the Planning Analytics train and enjoy the ride!
