Overview
This is the second part in our series about Cognos Analytics 11. In the first part we discussed an overview of new features and in detail, data modules and dashboards. This second part will deal with reporting, architecture and more administration related topics.
Reporting
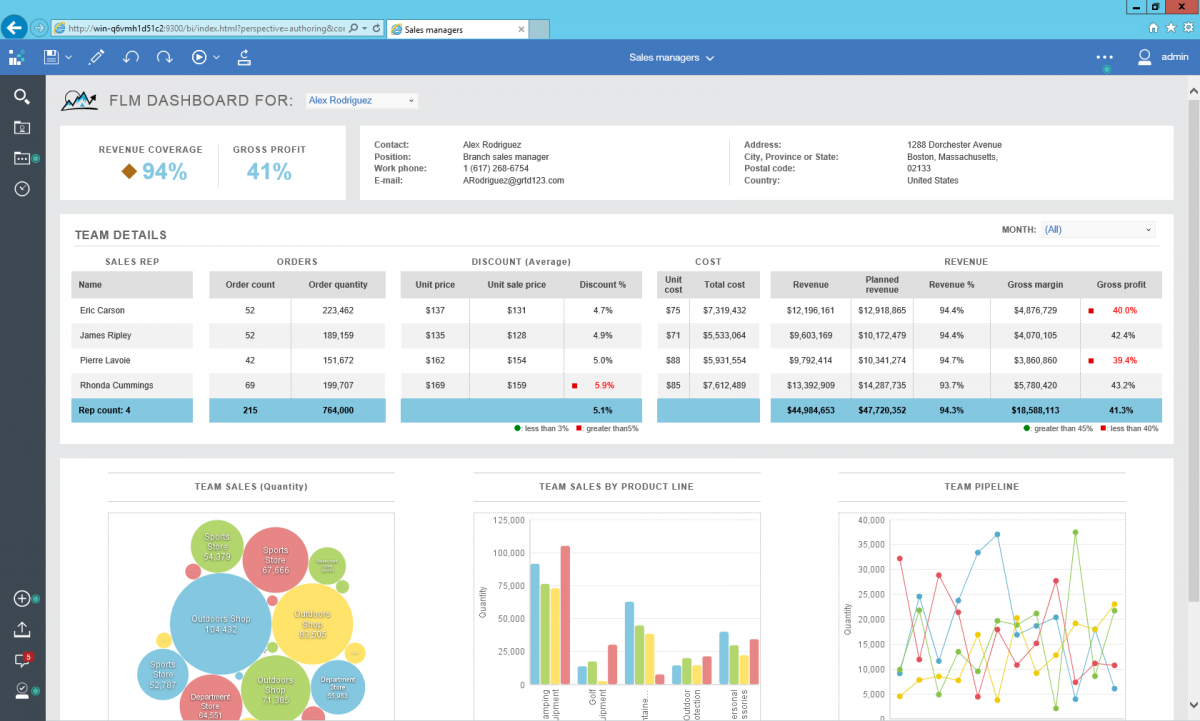
The reporting module is a completely new module that allows building self-service reports for analysis and data exploration as well as building sophisticated multi page, multi query reports. It has an easy and intuitive drag and drop user interface to create ad hoc queries. This module replaces Report Studio, Analysis Studio, Query Studio and Workspace Advanced but uses the same metadata definition as the old studios. This means all the reports that were created in previous versions of IBM Cognos can easily be upgraded to the latest version. The reporting module is not only used to build reports but also to do ad-hoc analysis.
The interface is completely new and very intuitive, exposing functionality only when required. Despite the ‘simple’ look, all the functionality that was in Report Studio is there. It does take a while to get used to the new interface and find all the menu’s. Using the sliding panels, the canvas is optimally used when designing a report as the user can choose to show or hide properties and free up canvas space as needed.
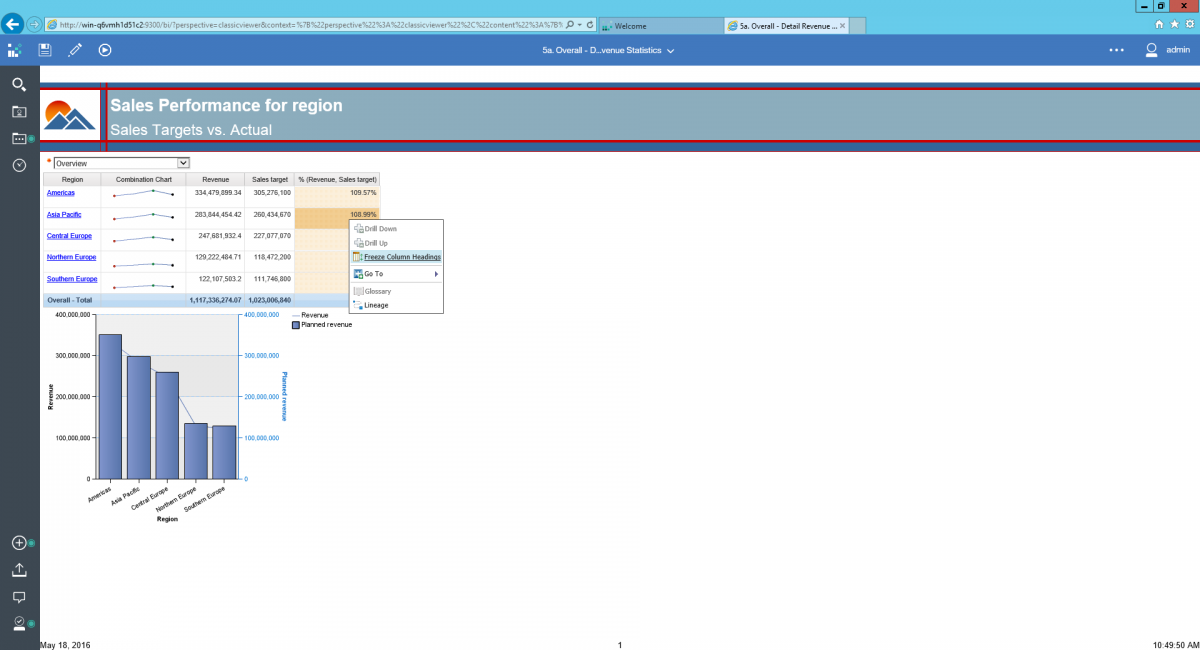
A report shown in Cognos Viewer.
Viewer
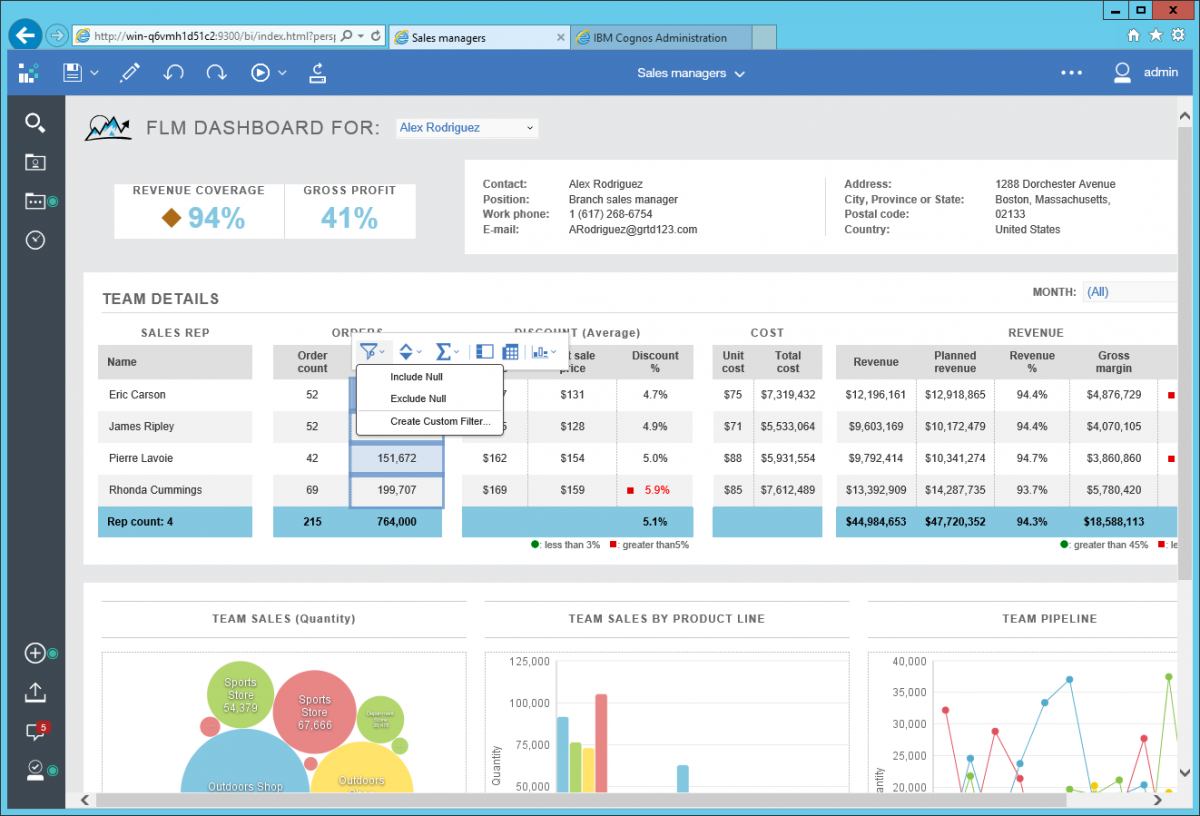
A report can be shown in full interactive viewer and the normal viewer. The fully interactive viewer allows users to make changes in the report such as drilling, filtering and sorting data, choosing a different chart or switching between a crosstab and a list. This functionality resembles quite well what already was avaible in Cognos Workspace. Report consumers can save the changes they make to a report. The normal viewer offers the classic, trusted viewer that was used in the previous versions of Cognos. By default, interactivity is enabled for new reports and disabled for upgraded reports. This behaviour can be easily changed by setting a property at report level. It should be noted that standard reports can switch without issues, but special cases, like reports with JavaScript or Prompt API will need some modifications to run properly.
Interactive Viewer
Non Interactive Viewer
Drilling up and down a hierarchy, for example: moving down through a hierarchy like world-continent-country-province-city-street-house, is a wonderful feature that has existed since the early days of OLAP analysis. It allows the user to quickly zoom into problem areas in the data. There is another form of zooming- in called drill-through. Drill-through will open another, often more detailed report, when clicking on a cell or intersection. Reporting parameters are passed from the calling to the receiving report, limiting the amount of data being shown to the context of the calling report.
The non-interactive viewer supports drill up/down and drill through exactly the same way as in the previous releases. Using the fully interactive mode drilling is supported, albeit currently there are some limitations: the fully interactive viewer will not support drill through and drill down on lists. Drill through is not supported on data modules, but it is on packages. This functionality will be added in a future release. The interactive viewer however, offers much more data exploration options than just drilling. The tool bar will allow the user to modify the filtering, sorting, adding summaries, supressing null values, swapping rows and columns and changing the chart type all together. Advanced set analysis is also available in this toolbar. Lineage and Glossary are supported for Framework Manager and Dynamic Cubes but only when running in the non-interactive viewer.
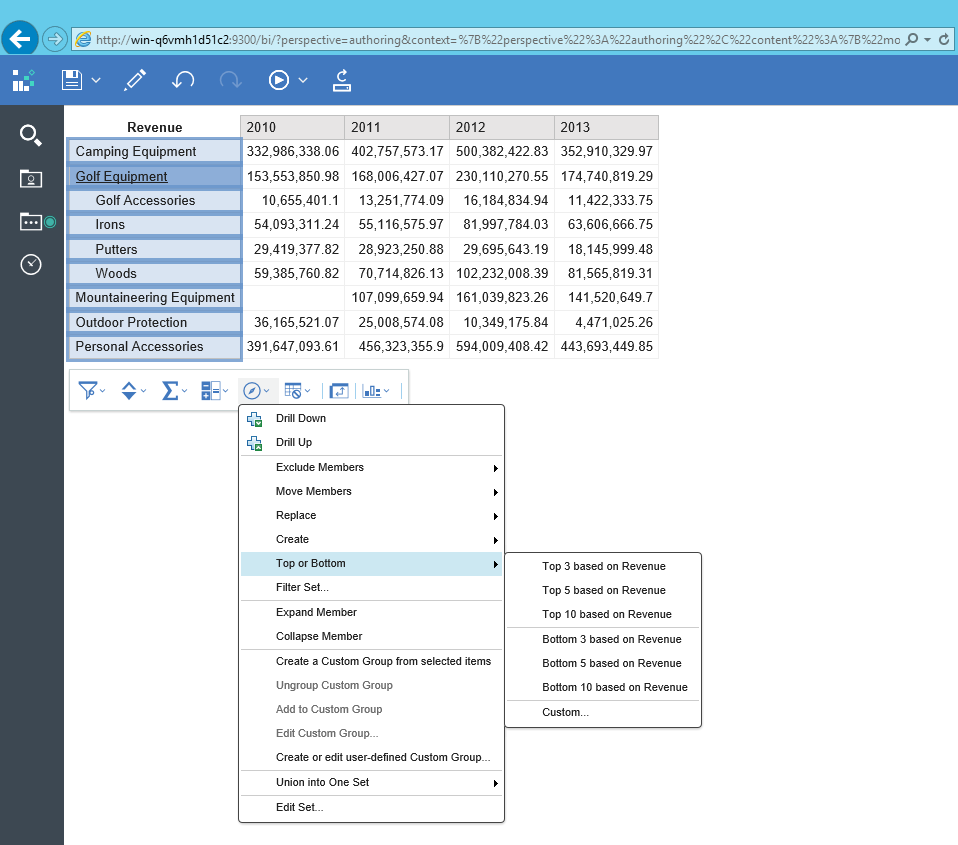
Advanced Set Analysis
The set analysis features allow the business user to do ad-hoc analysis of the data. Members can be added, excluded, moved and replaced by different levels of children. Creating a ‘topX’ is really easy and requires a single click. Very convenient is the feature to expand/collapse member. This feature will expand a member with its children in a new column, just like it is done in Excel. A combination of members can be added to a custom group, for example to group two regions in an overlying structure.
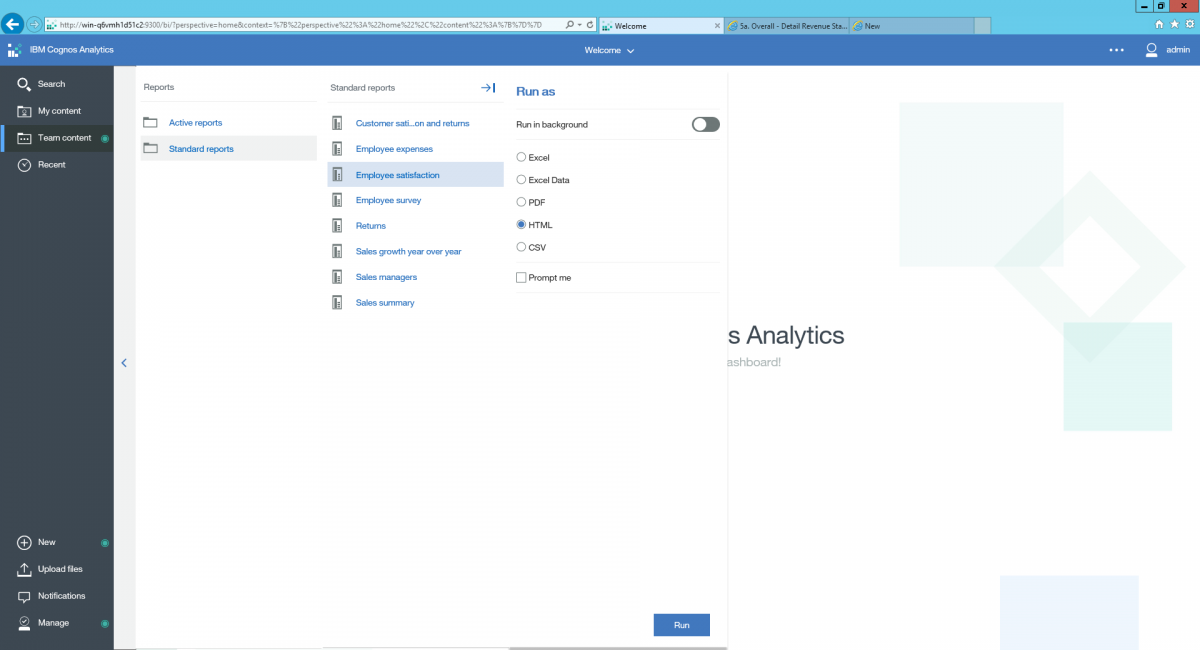
In terms of exporting reports there is also a difference between non-interactive viewer and the interactive viewer mode. The non-interactive viewer will export to PDF, Excel (both data and formatted) and raw data in CSV. XML has been removed from the interface, but can still be generated using the SDK. When running from within the interactive viewer only HTML and PDF can be selected. It is however possible to export to all other formats by selecting ‘Run as’ in the portal.
Run as menu allows for exporting to Excels
Authoring
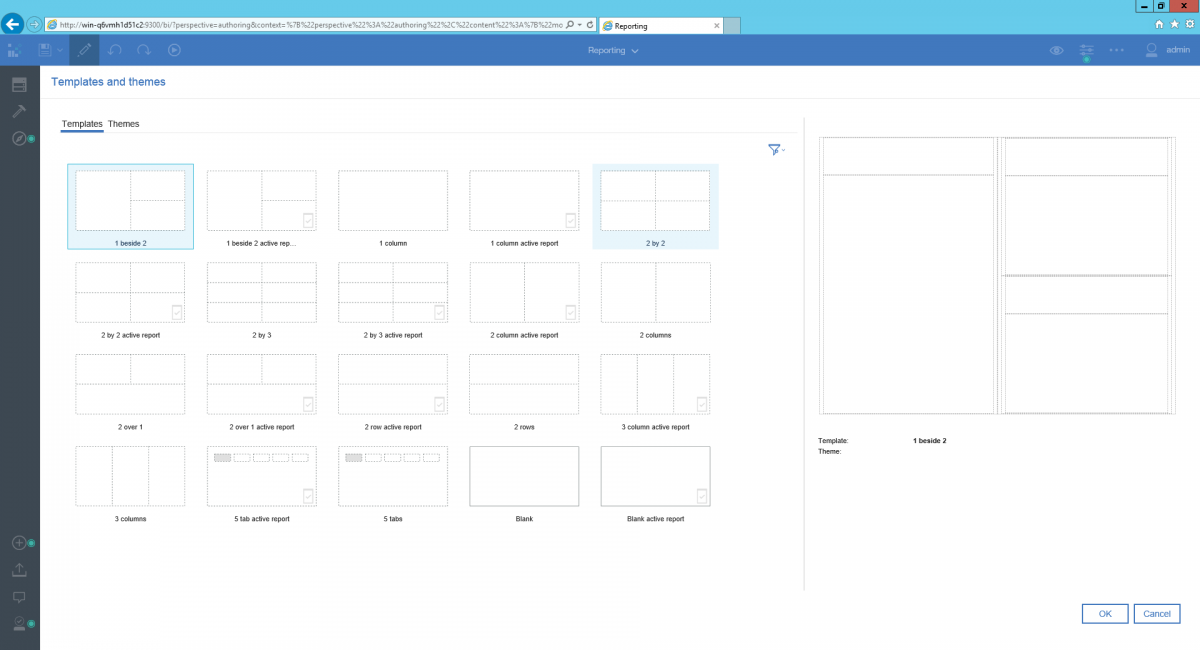
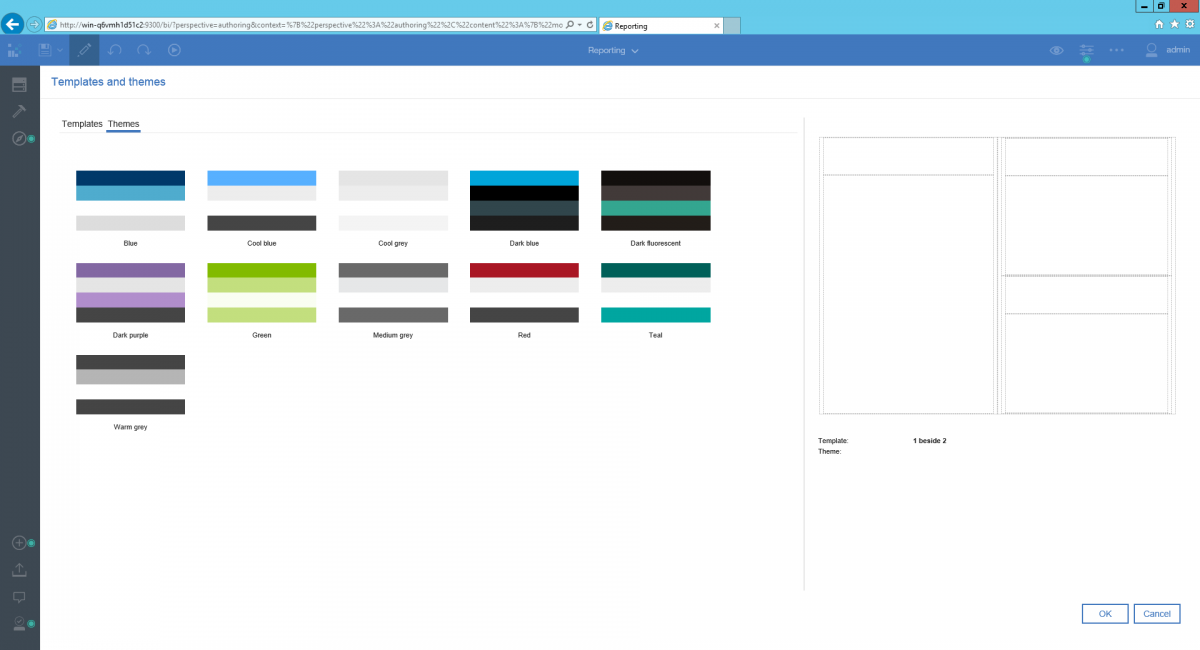
When creating a new report, a default layout, type of report and theme can be chosen. This allows the author to quickly create a report that has a responsive layout and is beautifully styled.
Templates
Themes
Several templates are available and a distinction is made between a normal report and an Active report. The first is for connected use, the latter can be made available offline and offers more options for interactivity.
The next step in building a report, is selecting a data source that will feed the report with data. The source of a report can be a package and a data module. The variety of data sources that can be used to build reports is very large and includes Hadoop, cubing technologies and all major database vendors. Packaged with the Cognos Analytics installation are Dynamic Cubes, an in-memory cubing technology that is free to use and offers substantial performance gains in query times. (for more information &&hyperlink http://www.element61.be/e/resourc-detail.asp?ResourceId=754 ) IBM Cognos PowerCubes remain supported as a data source. PowerCubes remain the only IBM Cognos OLAP technology that allows to easily combine multiple data sources, whether these are database or flat files.
In an upcoming release IBM plans to add the capability of using multiple packages / data modules to build a report. For now, multiple data sources can be combined in a single package using Framework Manager and multiple data modules can be combined in an overlying data module.
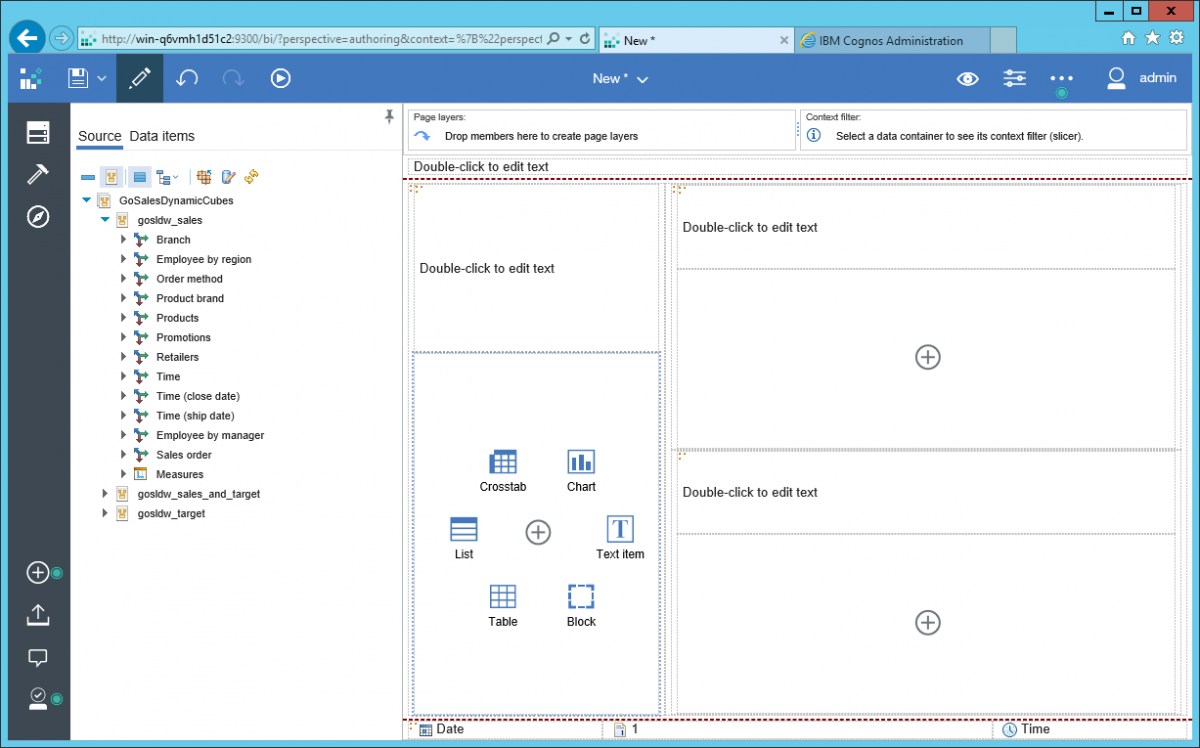
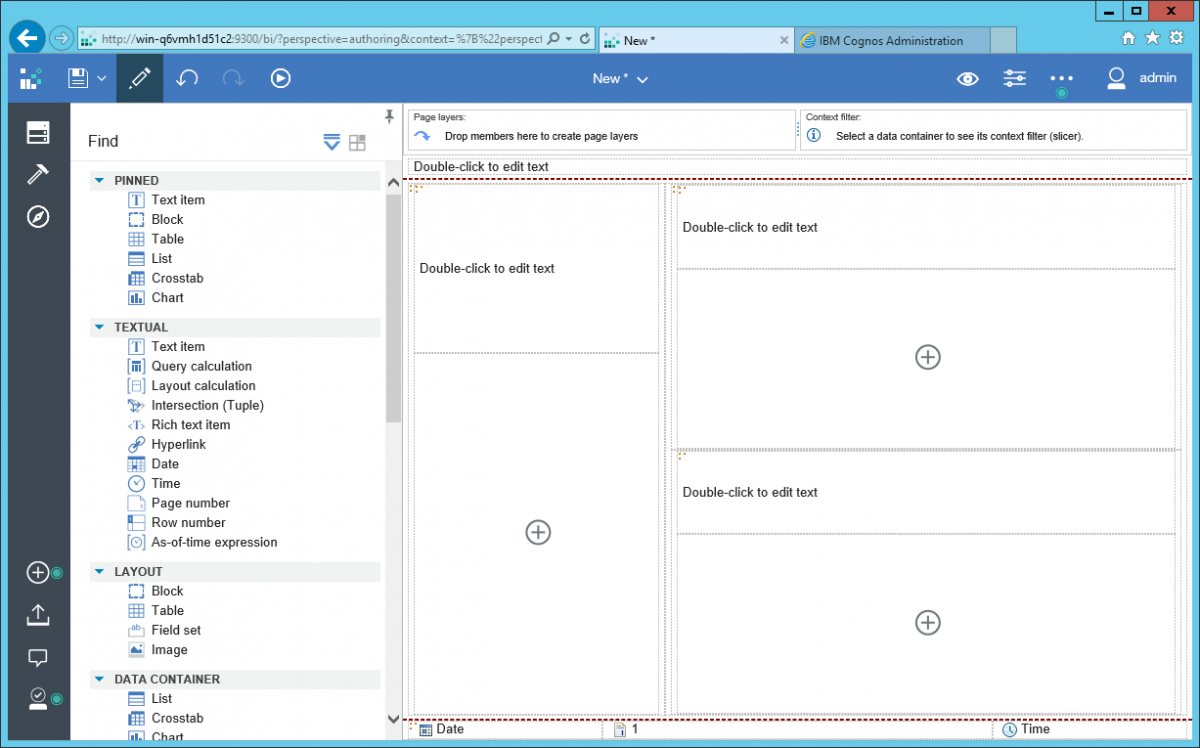
Editor interface
By clicking the plus sign, a popup menu will appear that allows quick selection of the most often used components. The templates offer a responsive layout, meaning that the columns and rows will resize depending on the device the report is ran on. The colour scheme allows to quickly format appealing reports without having to modify all the styles manually. Using the report properties, the style can be modified to a custom style or default template. For now, these templates cannot yet be customized but this is planned for an upcoming release.
At the left hand of the screen a number of icons will expose more advanced functionality. The first one will show all the data items that are in the package and in the queries that are already in the report. The toolbox will show all components that can be inserted, categorized by use. The toolset will show different components when a normal versus active report is authored. The last item is used to see report pages, edit queries and (active) report variables.
Toolbox showing all insertable components
When editing a report, the report can be shown in Page Design, Page Preview and Page Structure. Page Preview will render a report with a limited set of data, which comes in handy for quickly testing layout changes. Page Design is the normal authoring environment and page structure will show a structure of all the components on the page. This view is really useful when dealing with a lot of nested components.
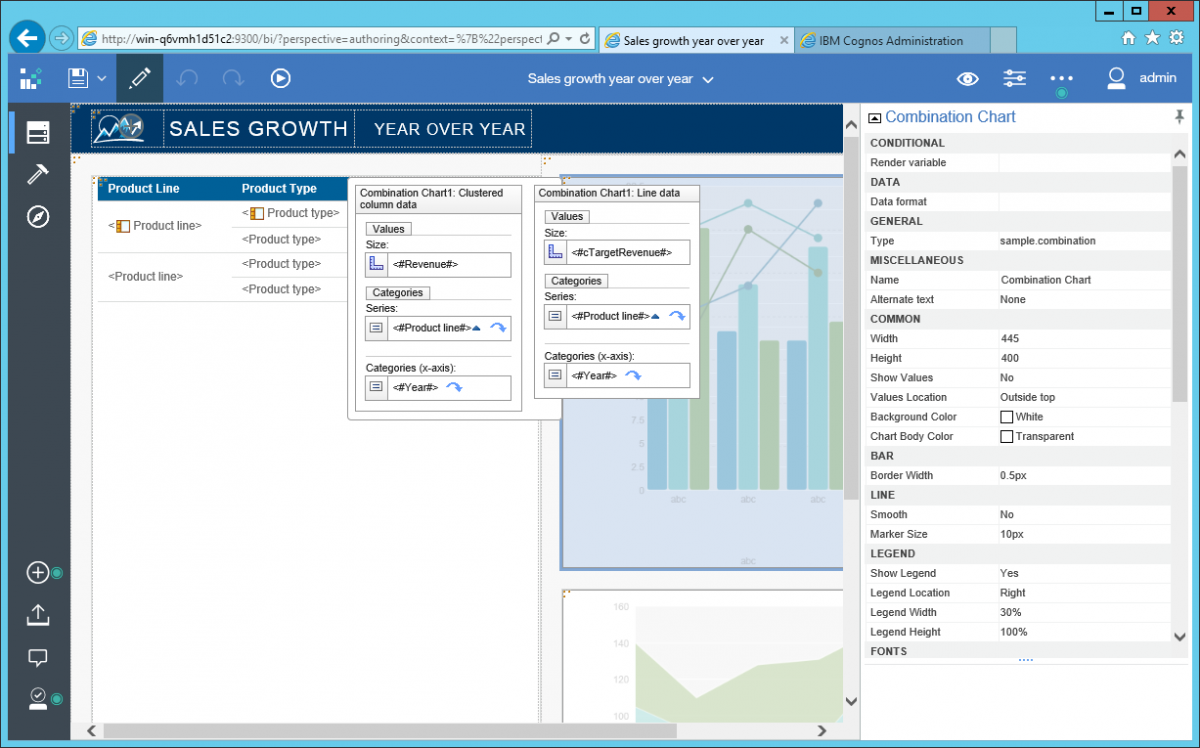
The properties pane will expose the advanced properties of objects and will look very familiar to experienced report authors.
The properties panel
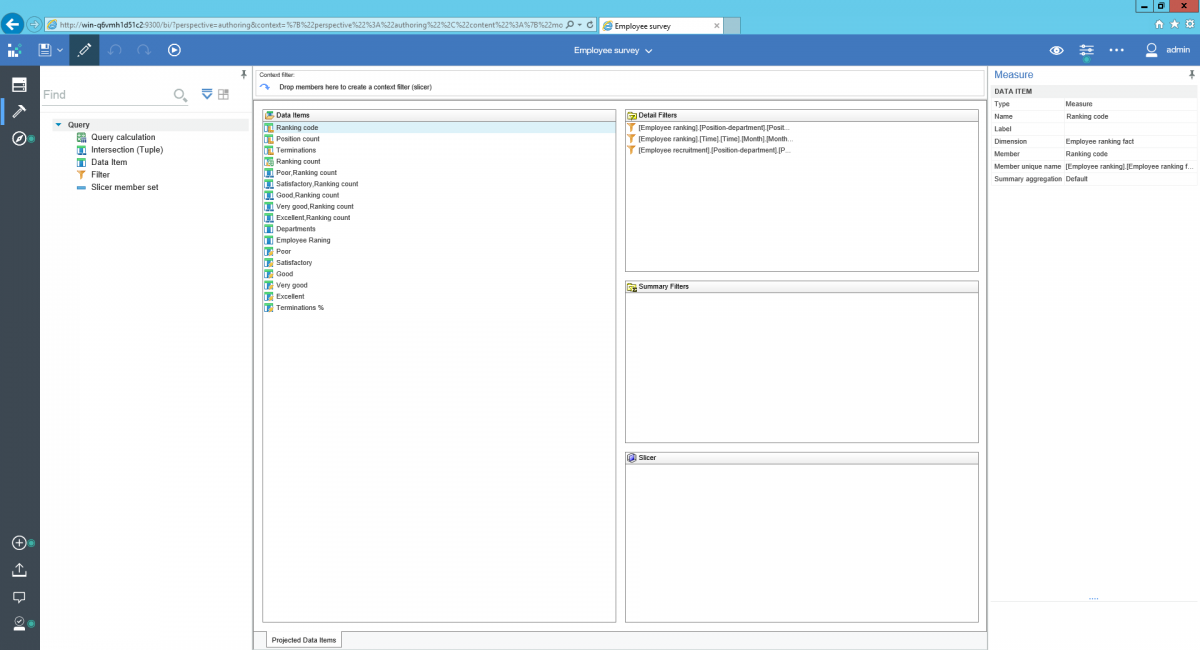
Editing queries looks very familiar to Report Studio. The data items can be selected from the package or custom data items can be added. When the package is dimensional, slicer filters can be added to the query. With relational sources, detail filters can be added. When clicking on the folder Queries, an overview of all queries is shown. Combined with the toolbox, new queries can be added or existing queries can be joined using different set operations.
Editing queries
Report Flavour
There are 2 flavours of reports that can be build. The first are classical reports that use prompt values to offer interactivity to the user. These reports can be scheduled, bursted and have been the de facto standard in reporting for years. Every time a prompt value is filled a query is fired and the report is refreshed. These reports can only be used while being connected to the system, unless the report was exported to PDF or Excel. Therefore, these reports can leverage data security that was specified in the package. For example, a region manager can only see certain regions in a report. Every time the report is rendered, the correct data restriction is enforced.
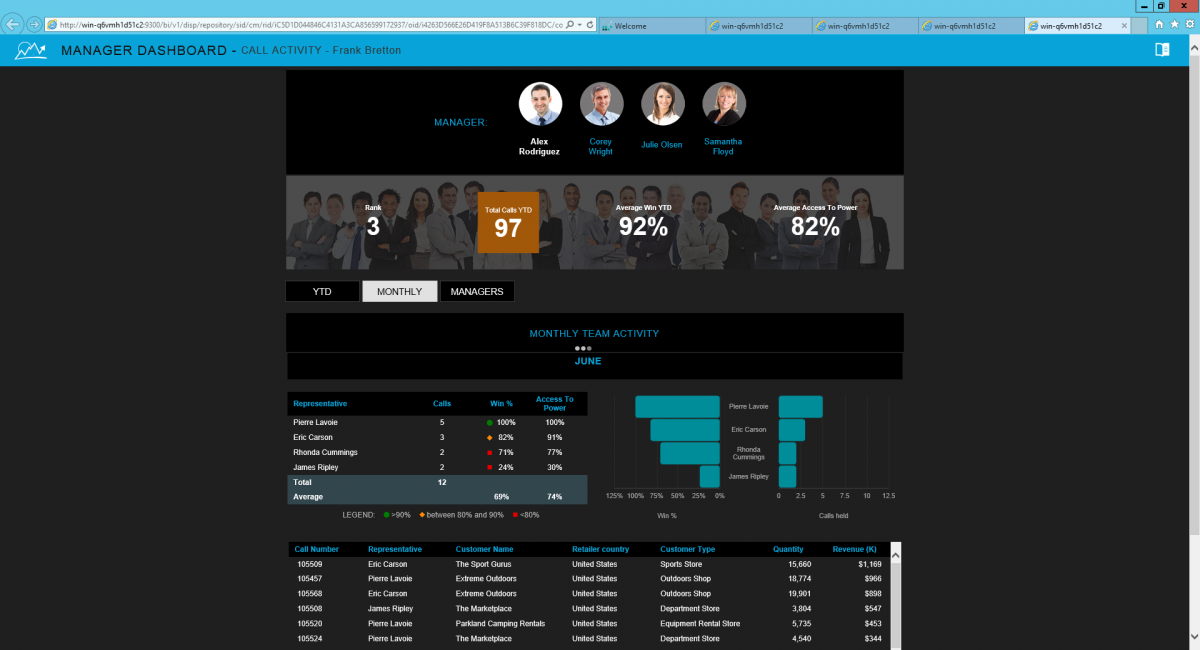
Since Cognos Business Intelligence 10 a second flavour of reporting was added: Active Reports. Active reports provide very graphically formatted dashboards that host a lot of interactivity. The reports are pre-run, so when applying extra filters, no queries are needed since the data is already there. No connection to the server is needed as an Active Report is kept in a self-contained file. This allows for easy distribution through email or a mobile device. The interactivity is defined when authoring the report and uses a set of active report variables to highlight or select data. The RAVE visualisations are optimised to use these variables and allows basic analysis in the report. Active Reports are optimized to use mobile devices as they are both interactive, highly visual and support the mobile user interface, for example by swiping.
An active report
Active report interactivity is driven by variables that are either static or data-driven. Variables can be used to drive the behaviour of other controls. The reaction behaviour can be of three types. The first type is filtering: the parent is using a value to filter the child. For example: a list within a tab control is filtered with the value that is in the tab control. The second type of behaviour is select, for example a slice in a pie chart can be highlighted. The third type of reaction behaviour is to enable or disable controls depending on the status of a variable. A variable can contain labels, free text or data values. Therefore, most active report controls exist in two flavours: data-driven and static. Static controls will use values entered by the report designer while a data driven control will use values retrieved from a database. For example: a tab page control can be based on product line, or static values for each tab can be entered. Using this combination of variables and controls nearly anything can be achieved. For example: depending on the value of a button bar; a list, crosstab or bubble chart is shown. A static variable can also be used to modify the behaviour of lists and charts. For example: depending on a checkbox a forecast might be added on a bar chart. A data driven variable could be used to highlight data or select specific data in another control. For example: a product line is highlighted in a list when a bar in a bar chart is selected. Or, when clicking a pie in a pie chart, the values in a list chart are modified to reflect the value of the pie chart.
The concept of Active Reports is very powerful and the hardest part in building Active Reports is without doubt achieving a user friendly and well thought through interactivity model. New in Cognos Analytics 11 are Report Links. They allow to open a standard report from within an Active Report in an iFrame. Report links can only open standard reports, not Active reports. This functionality allows to show live ‘drill through’ data from within an Active Report.
Charting
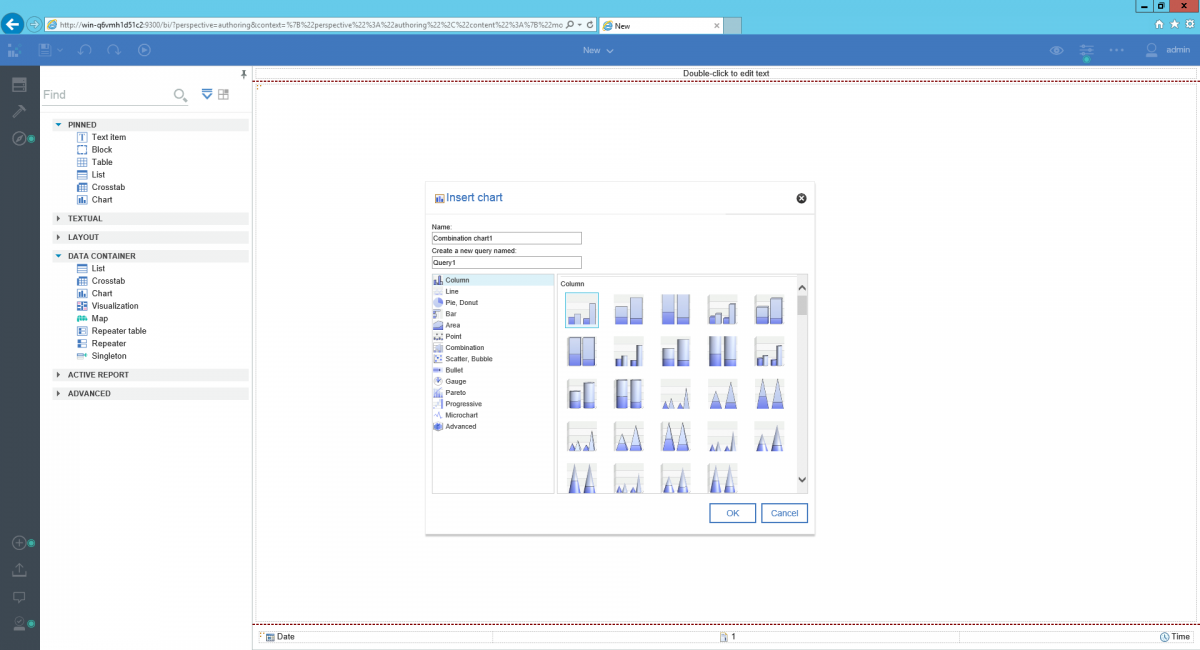
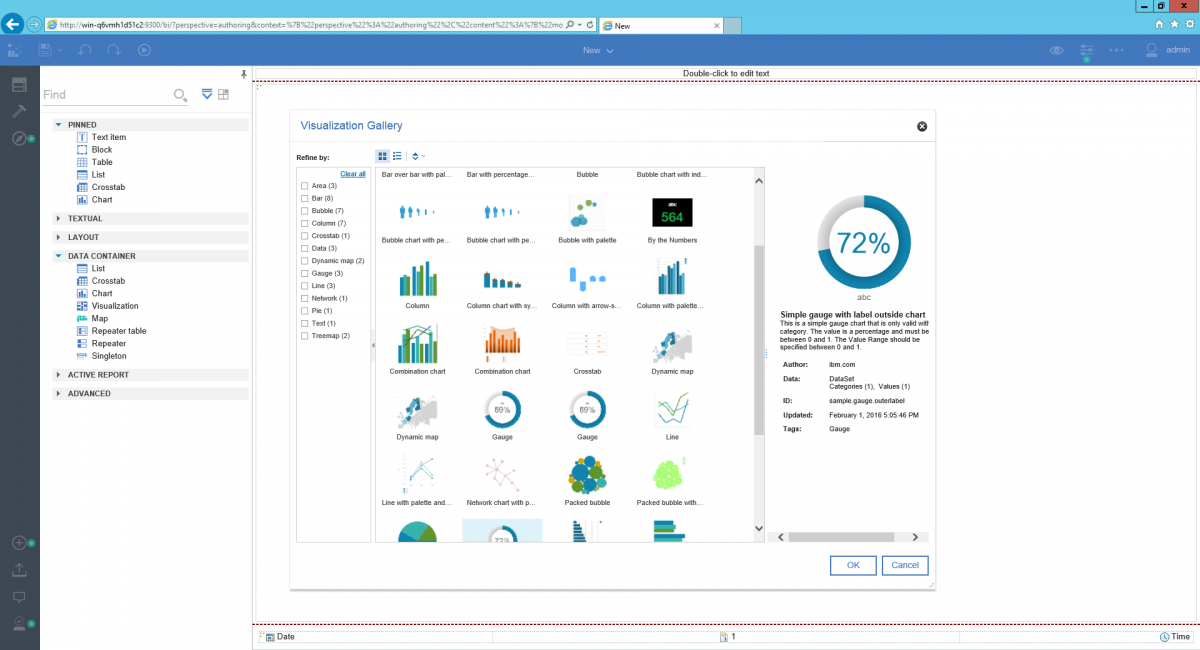
Cognos Analytics 11 has exactly the same charting options as IBM Cognos Business Intelligence 10.2.2. Both classical charts (even Cognos 8 style) and visualizations are available to use. The classical charts offer much more flexibility as a lot more properties are available for modification than with visualizations. However, all the new charts are only available as visualizations such as the Bubble chart with person shaped bubbles or the Packed Bubble chart. In standard reports a combination of classic charts and/or visualizations can be used.
Cognos Analytics 11 Charting
In Active Reports however, visualisations are a condicio sine qua non. Only a visualisation can be used to filter data using another Active Report Control. This feature shapes the interactivity of an Active Report. When clicking on a control data is filtered in another control. Classic charts in Active Reports only allow for the selection of data on the chart and not filtering. To accomplish the same behaviour a master detail relation would be needed, but in the context of complex Active Reports this is not feasible.
In IBM Cognos Business Intelligence 10.2.2 effort was done to increase the number of adjustable properties, but there is still some work needed on that part. The charts are written in JSON and can be customized using the Visualization Customizer. However, new releases of visualisations often mean the reports using them need rework to replace visualisations with the new versions. It is also possible to import upgraded visualisations definitions from previous releases. This will keep reports running but the visualisations used will be the old version. Currently IBM is working on Rave 2.0 which should provide a significant improvement to visualizations.
The visualization gallery
Companion Apps
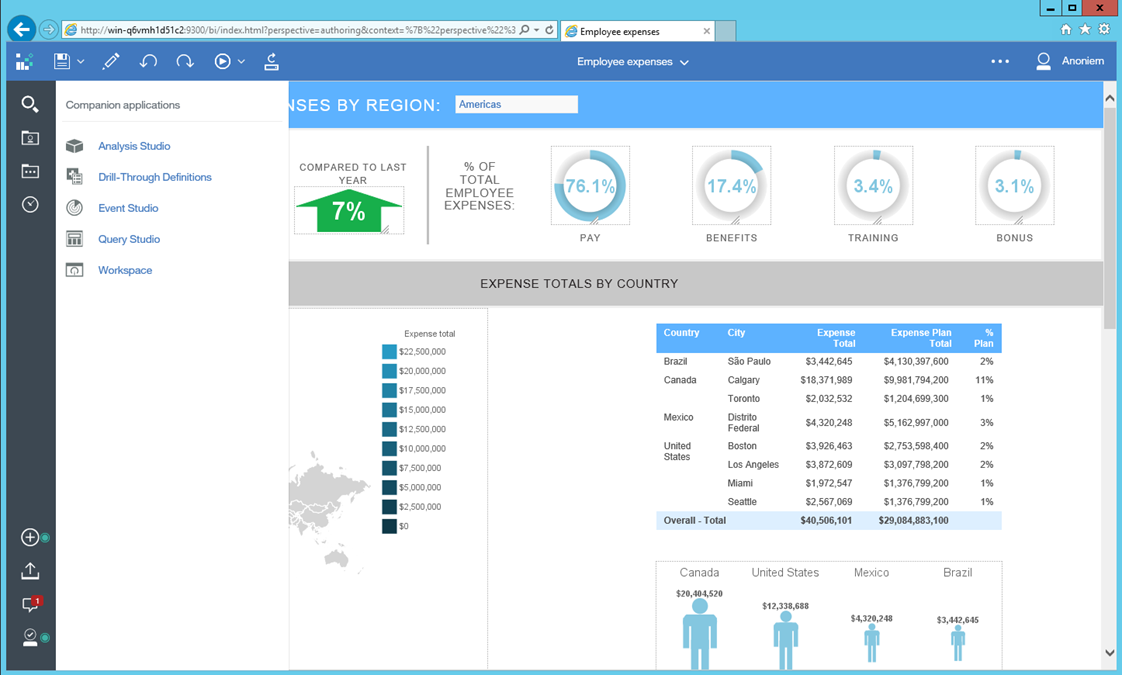
The old applications Query Studio, Analysis Studio, Event Studio and Cognos Workspace are included as companion apps. That being said, IBM immediately states that they will drop Query Studio, Analysis Studio and Cognos Workspace the next release. Cognos Workspace will be replaced by the Dashboard module. Functionality of Query and Analysis Studio will be ported to the Reporting Module. Event Studio is still available in Cognos Analytics and will be so until the functionality is ported.
Cognos Analytics will not allow the creation of new portal pages. Upgrade pages can be maintained but cannot be set as Home. The use of portal pages is discouraged and should be abandoned as quickly as possible. My Inbox is accessible and remains unchanged versus Cognos Business Intelligence 10 but only appears when the Legacy Applications are enabled. The same applies for My Watch Items, however no new items can be created. It is planned to be included in a future release of Cognos Analytics.
Companion Apps
Companion apps are always launched in a new window and look exactly the same as in Cognos Business Intelligence 10.2.2. They are only available if the legacy applications are enabled. This option can be set during install or enabled later by modifying the Legacy Switch that is located in a configuration file.
Mobile
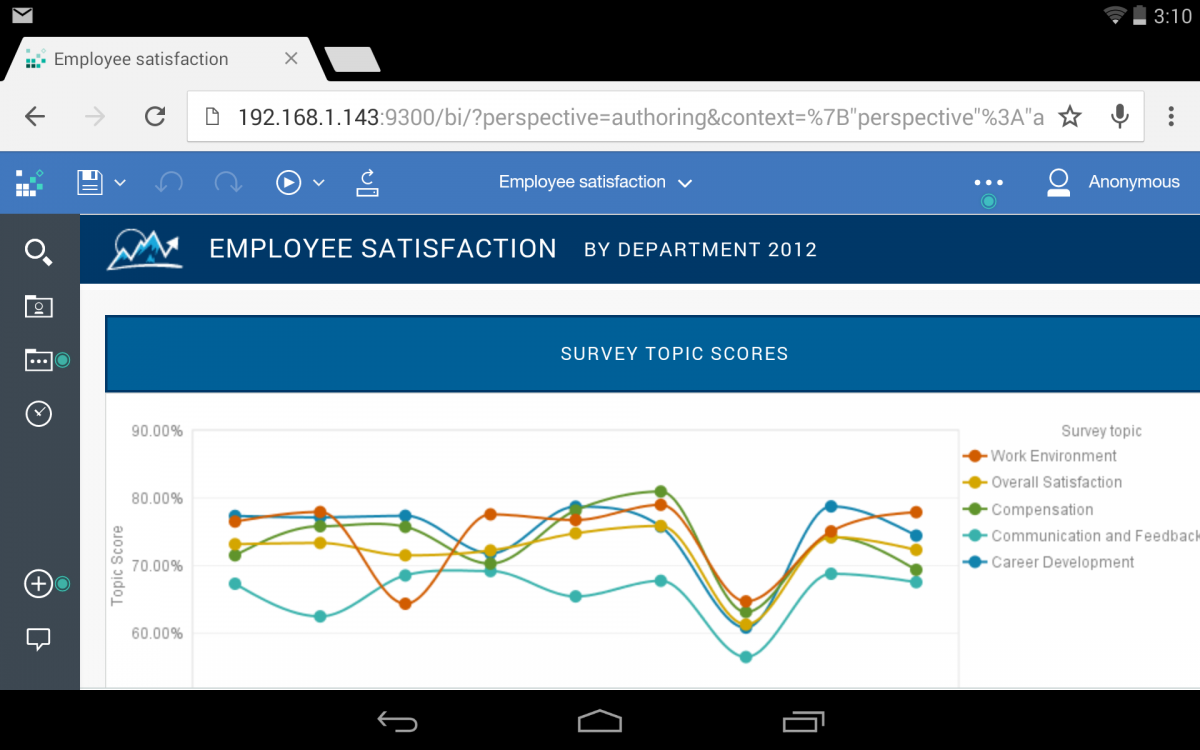
Standard reports run from the browser on a mobile device.
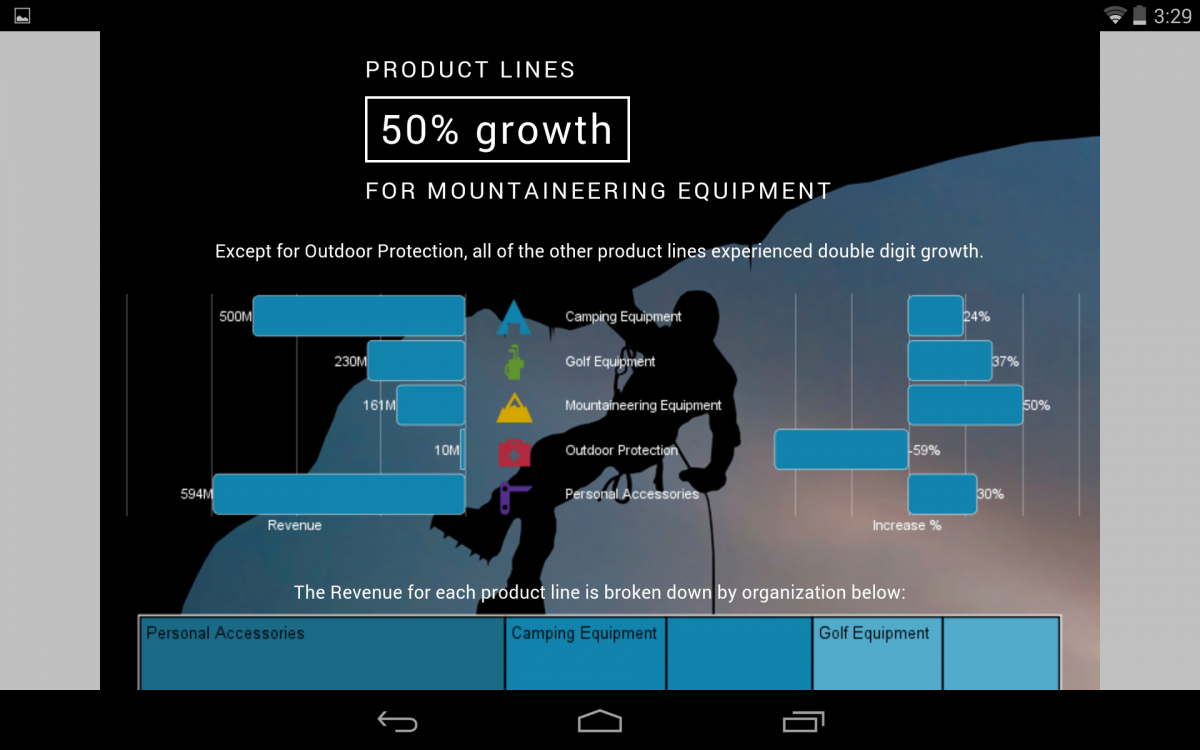
Cognos Analytics 11 makes a clear distinction between online and offline content when consumed from a mobile device. Online content such as running a report or browsing the content store is no longer done from within the app but should be done from a browser just like when working on a desktop computer. The new interface of Cognos Analytics is fully touch enable, providing a better and more consistent user experience. Content will be shown exactly the same using a browser on a tablet or desktop computer, but can be easily manipulated using gestures, such as the swipe gesture. The native app is only used to consume pre-run saved Active Reports. For users using previous versions of Cognos nothing changes. The latest release of the app is fully backward compatible.
Running an Active Report in the native app.
Administration
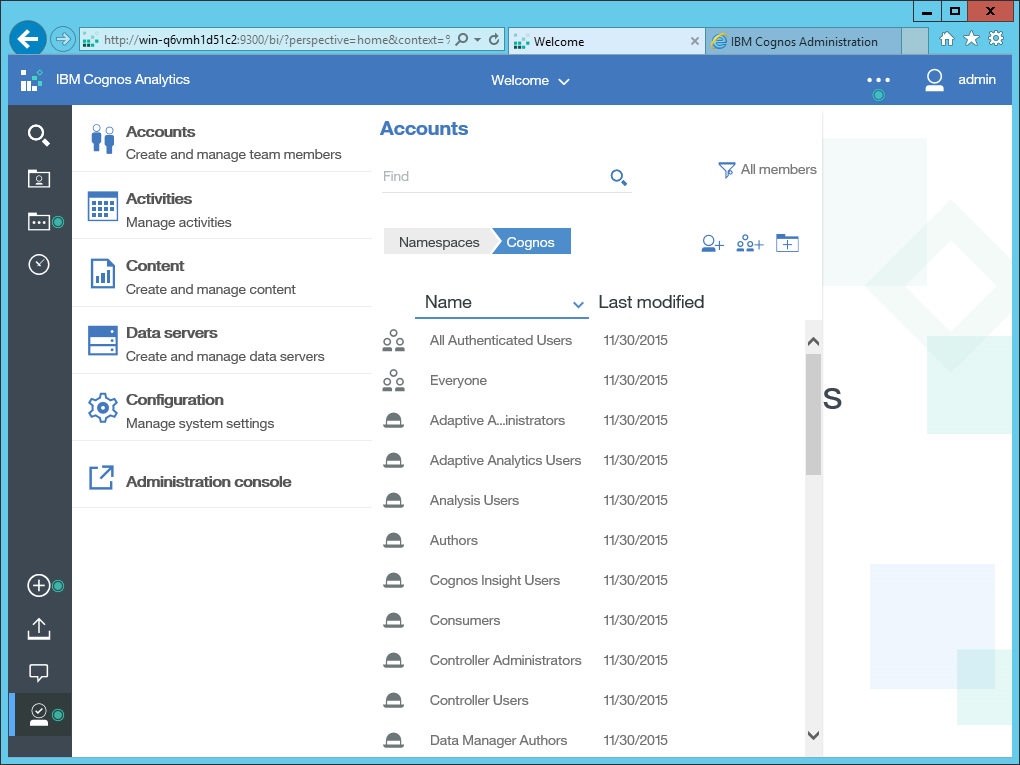
A new administration console will bring a subset of administrative capabilities that are often used by business users that maintain the environment. They are able to basic administrative tasks such as manage accounts, schedule and monitor activity, perform backups… This console allows for the creation of data servers that are needed to build data modules.
Business Users administration portal
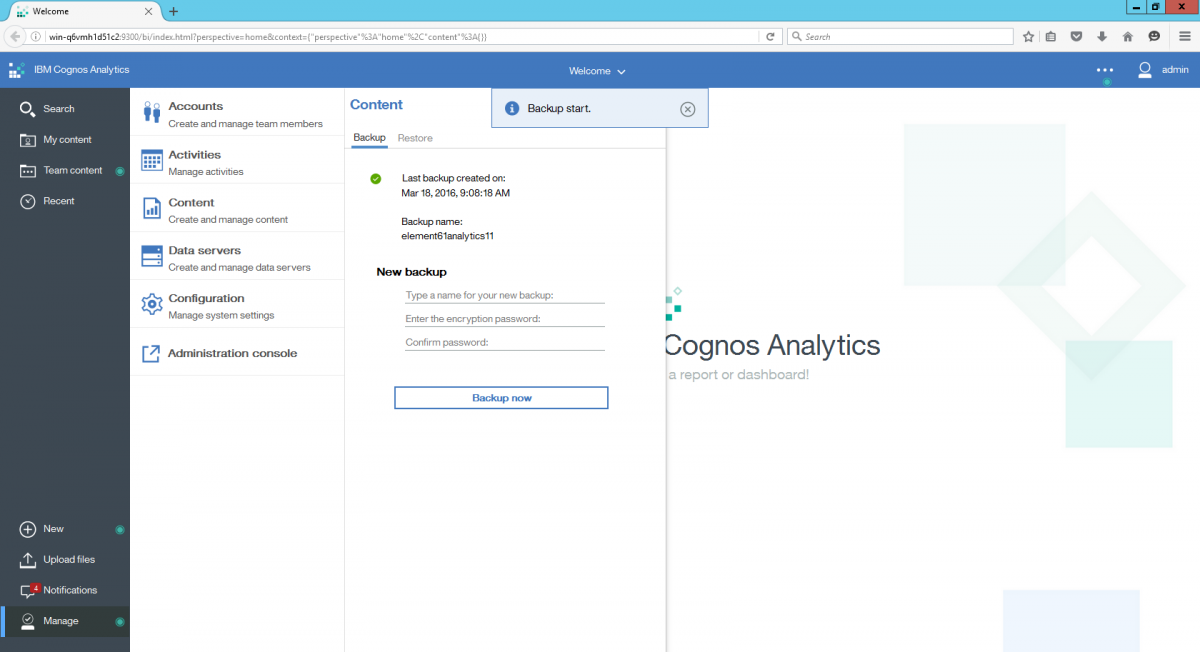
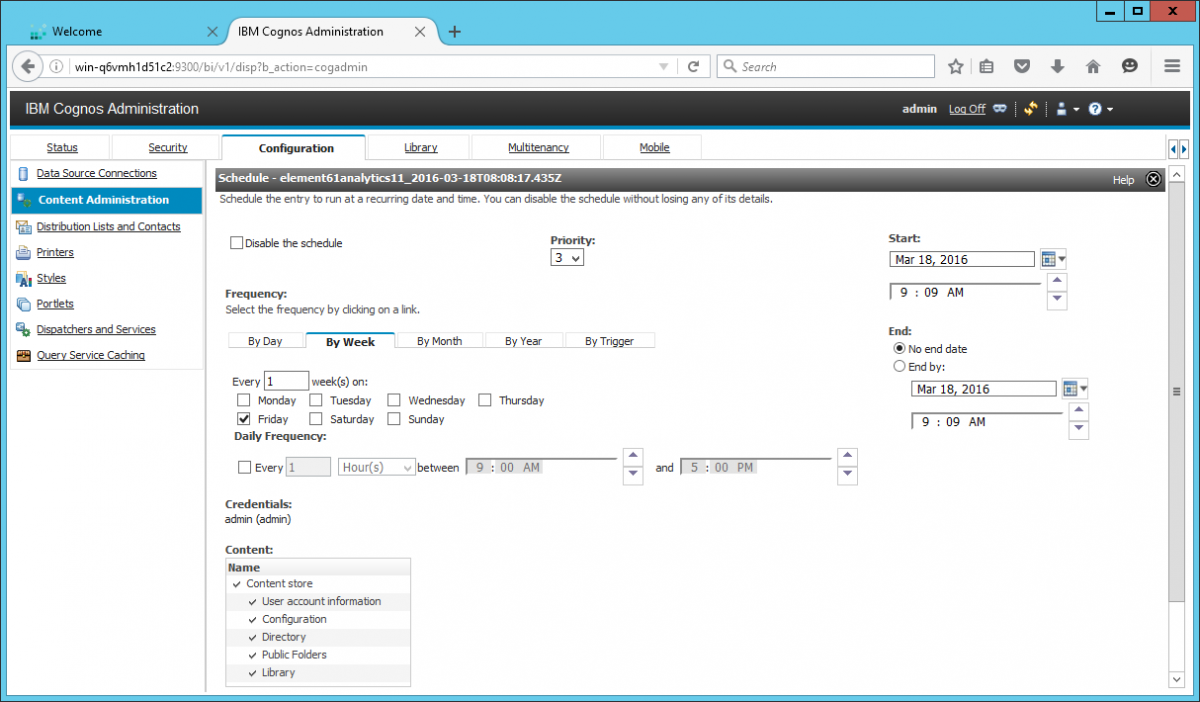
Backups are done from the content portal, but scheduling of a backup is done from the old administration console.
Performing a full backup
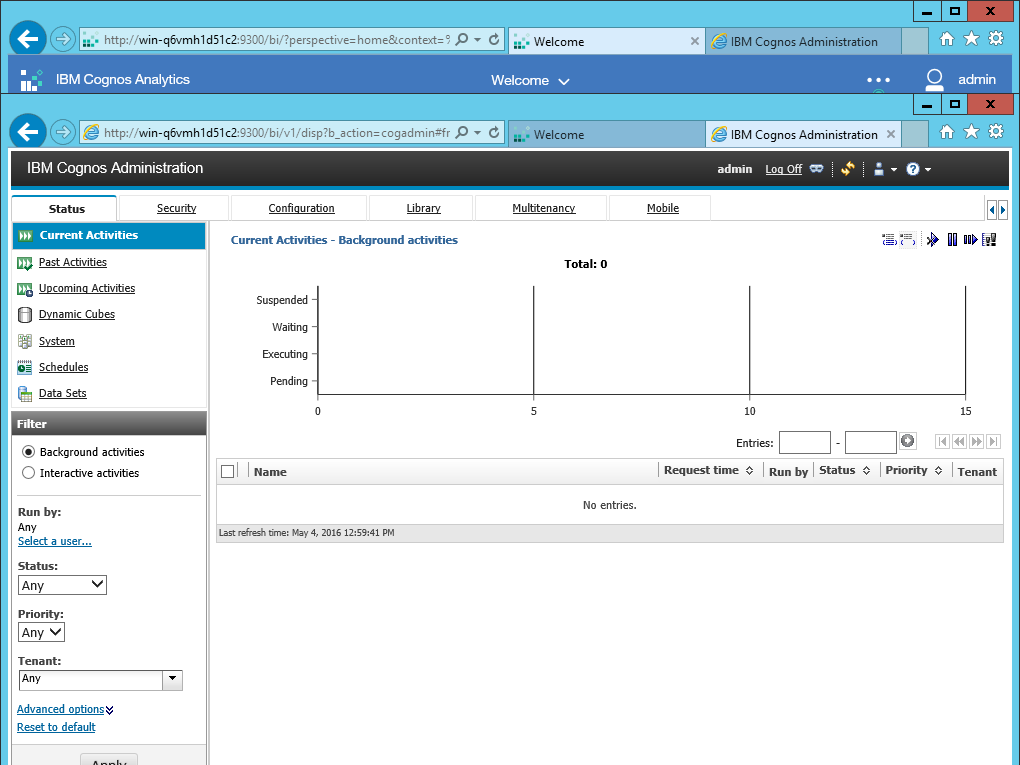
The Administration console will open the old Cognos Administration that was used in previous versions. It is needed to do the more advanced system administration and is exactly the same as in previous versions. The Administration console will additionally take care of monitoring of Dynamic Cubes, setting advanced system parameters, logging levels and enabling multi-tenancy. It is also used to maintain the library of RAVE visualizations and Cognos Mobile configuration. IBM plans to port all this functionality to the Cognos Analytics platform in an upcoming release.
Cognos Administration Console
Installation
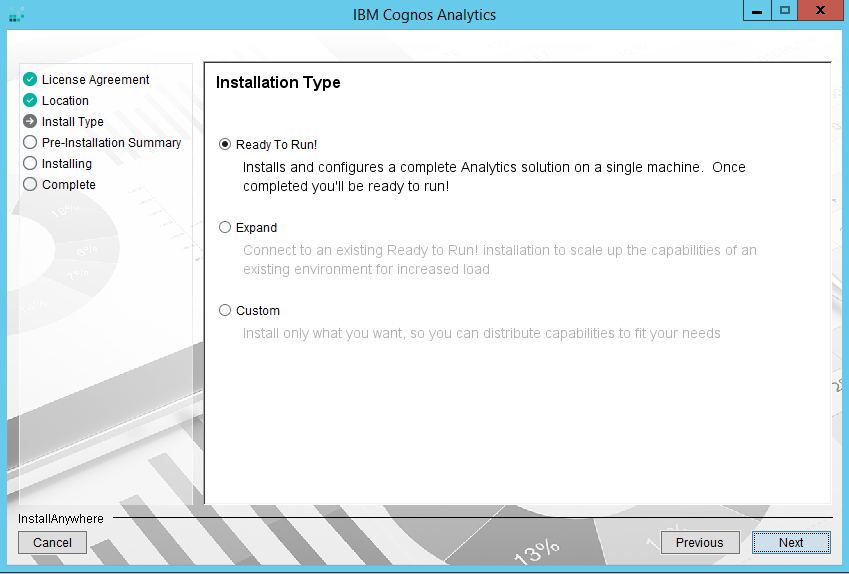
When installing the product three installation types can be chosen: Ready to run, expand and custom. Ready to run will install a version that is ready to run, including an application server, authentication provider and preconfigured content store. By default, an IBM Websphere application server is installed. With a Ready to run installation, Apache Derby is installed as an authentication provider and Informix is used as a content store.
Installation Types
An Expand installation provides easy scaling and will install and additional application tier on an additional server. Load balancing is done automatically by the Cognos Dispatcher but it is also possible to have a hardware load balancer on top of the cluster. Using a cluster will increase the report running capacity of the Cognos environment and provide failover if a node would go down.
Cognos Analytics no longer uses a gateway component but it can be installed optionally. This is required when single sign on is used. The authentication is still done using Internet Information Services. JDBC drivers are no longer installed in 2 separate locations but added in the installation/driver folder. Only the embedded WebSphere Application server is supported, it is no longer possible to setup your own application server. Cognos Analytics will run on Windows, AIX, Solaris and the Red Hat, Ubuntu and SUSE Linux variants.
Architecture
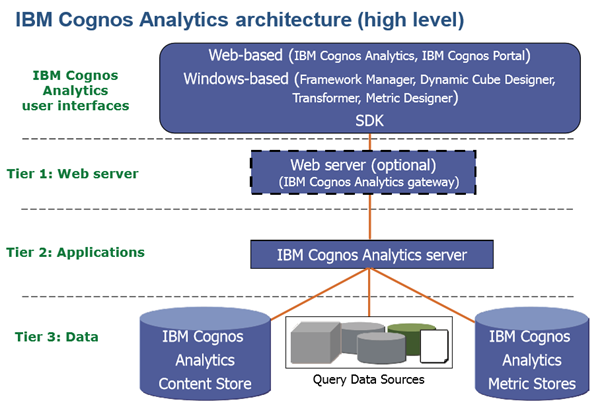
Cognos Analytics Architecture
A traditional Cognos environment is composed out of three components. The data tier or content manager will handle all requests concerning report definitions, stored report output, security in other words everything that is related to the content store. The application tier will actually process and run the reports and other requests including interface rendering. The third tier is composed of web communication. The gateway tier, that uses a web server will route incoming requests to the dispatcher. The most commonly used webserver in Cognos Business Intelligence 10 was without a doubt Internet Information Services. In Cognos 11, the webserver is an optional component. Requests are directed directly to the dispatcher. Only when Single Sign On is required, the optional gateway tier needs to be installed. The CGI and ISAPI gateway components are no longer being used, instead a reverse proxy is configured that points to the dispatcher.
Migration and upgrading from Cognos Business Intelligence 10
Upgrading from Cognos Business Intelligence 10 to Cognos Analytics 11 should be a straightforward operation. Just as with any other upgrade, the content store can be upgraded directly or a full export/import of the content store can be done. Because Cognos Analytics 11 uses standard HTML versus the quirks mode to interpret CSS styles, minor changes to layout and item size could occur in upgraded reports.
Reports, which use quirks HTML in IBM Cognos BI v10, now use standard HTML. Because of this change, there may be fine differences in item sizes. These will have no impact on the vast majority of reports but some small number, such as reports printed on forms, may need small tweaks. All other Studios or functionality like Inbox, Portal Pages, Watch Items and External Data, My Data remain available through the use of Companion Apps. It should be noted that the content in these Studios that are considered legacy should be moved as fast as possible to the new environments. This should be relatively straightforward as both Analysis and Query Studio use the same XML metadata definition as the Reporting Module.
Conclusion
The release of Cognos Analytics 11 marks a milestone in the Cognos product portfolio. This first version boosts an impressive new user interface and lots of new functionality. The user interface seamlessly transitions between mobile devices and desktop computers. The roadmap for upcoming releases looks very promising. This new version was focussed on self-service reporting, creating very user friendly authoring capabilities. Within a few iterations all functionality of Cognos Business Intelligence 10 will be replaced by new functionality in Cognos Analytics 11. Since all existing tools are still functional, an upgrade from a previous version should be straightforward. As IBM stated to drop some of the legacy tools in the next release, wisdom commands to not postpone an upgrade too long…
