Today, many industrial organizations and infrastructures use high-frequency sensor measurements to monitor and control machines and installations. The time-series data captured from these sensors has become an invaluable asset for these companies. For example, with the advent of IoT and big data technologies, this data can be integrated into the Modern Data Platform and combined with master data from various sources. In turn, it can be used for high-level monitoring dashboards, as well as machine learning applications such as production optimization and predictive maintenance.
To guarantee reliable and trustworthy results when using time-series data to make operational decisions, data quality must adhere to quality standards. As the well-known axiom garbage-in-garbage-out suggests, failure to maintain data quality can result in unreliable figures displayed on dashboards and biased or corrupted machine learning models.
Moreover, it is not uncommon for IoT data to have quality issues. Such problems can arise from sensor malfunctions, connectivity issues, manual interventions, and other factors. Unfortunately, ensuring data quality often requires extensive measures. Additionally, the scale and complexity of time-series data make this task time-consuming and often lead to overlooked critical issues.
Introducing Timeseer.AI, a platform-based tool designed to assess whether time-series data conforms to quality standards and addresses potential quality issues. This solution significantly reduces the time required to ensure data quality and prevents unreliable data from affecting operations.
What is Timeseer.AI
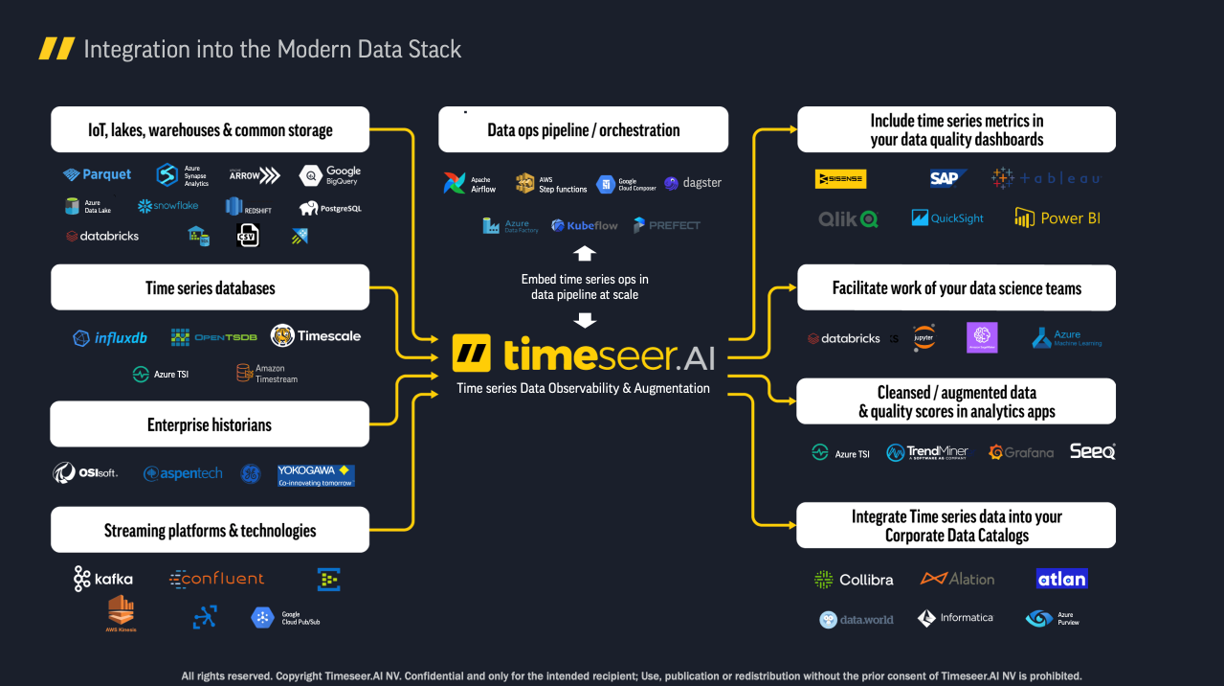
Timeseer.AI's mission is to empower data teams to detect, prioritize, and investigate data quality issues in time-series data before these impact operations. It is a self-hosted software platform that seamlessly integrates into the overall data platform, guaranteeing time series data quality through four key steps.
1 Data reliability scoring & profiling
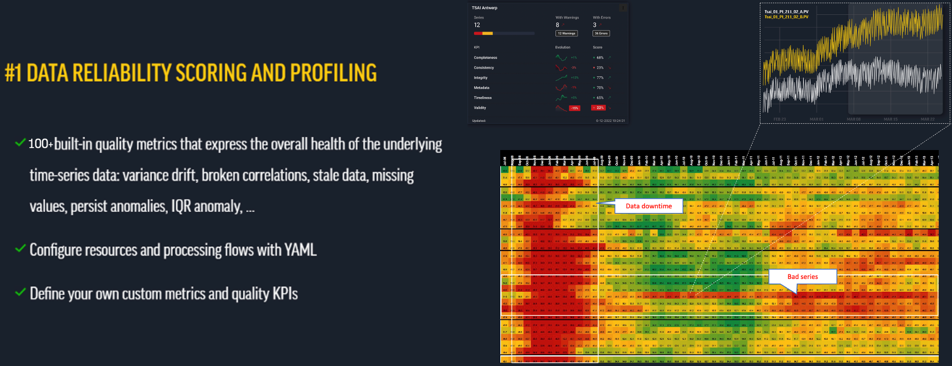
The first step involves profiling the data. Timeseer.AI offers over 100+ available profiling quality metrics such as variance drift, broken correlations, stale data, and more and also allows users to define their own metrics. These metrics assess the health of existing time series data by computing and storing statistics about the series. These profiles are then used to validate future data.
2 Data monitoring & observability
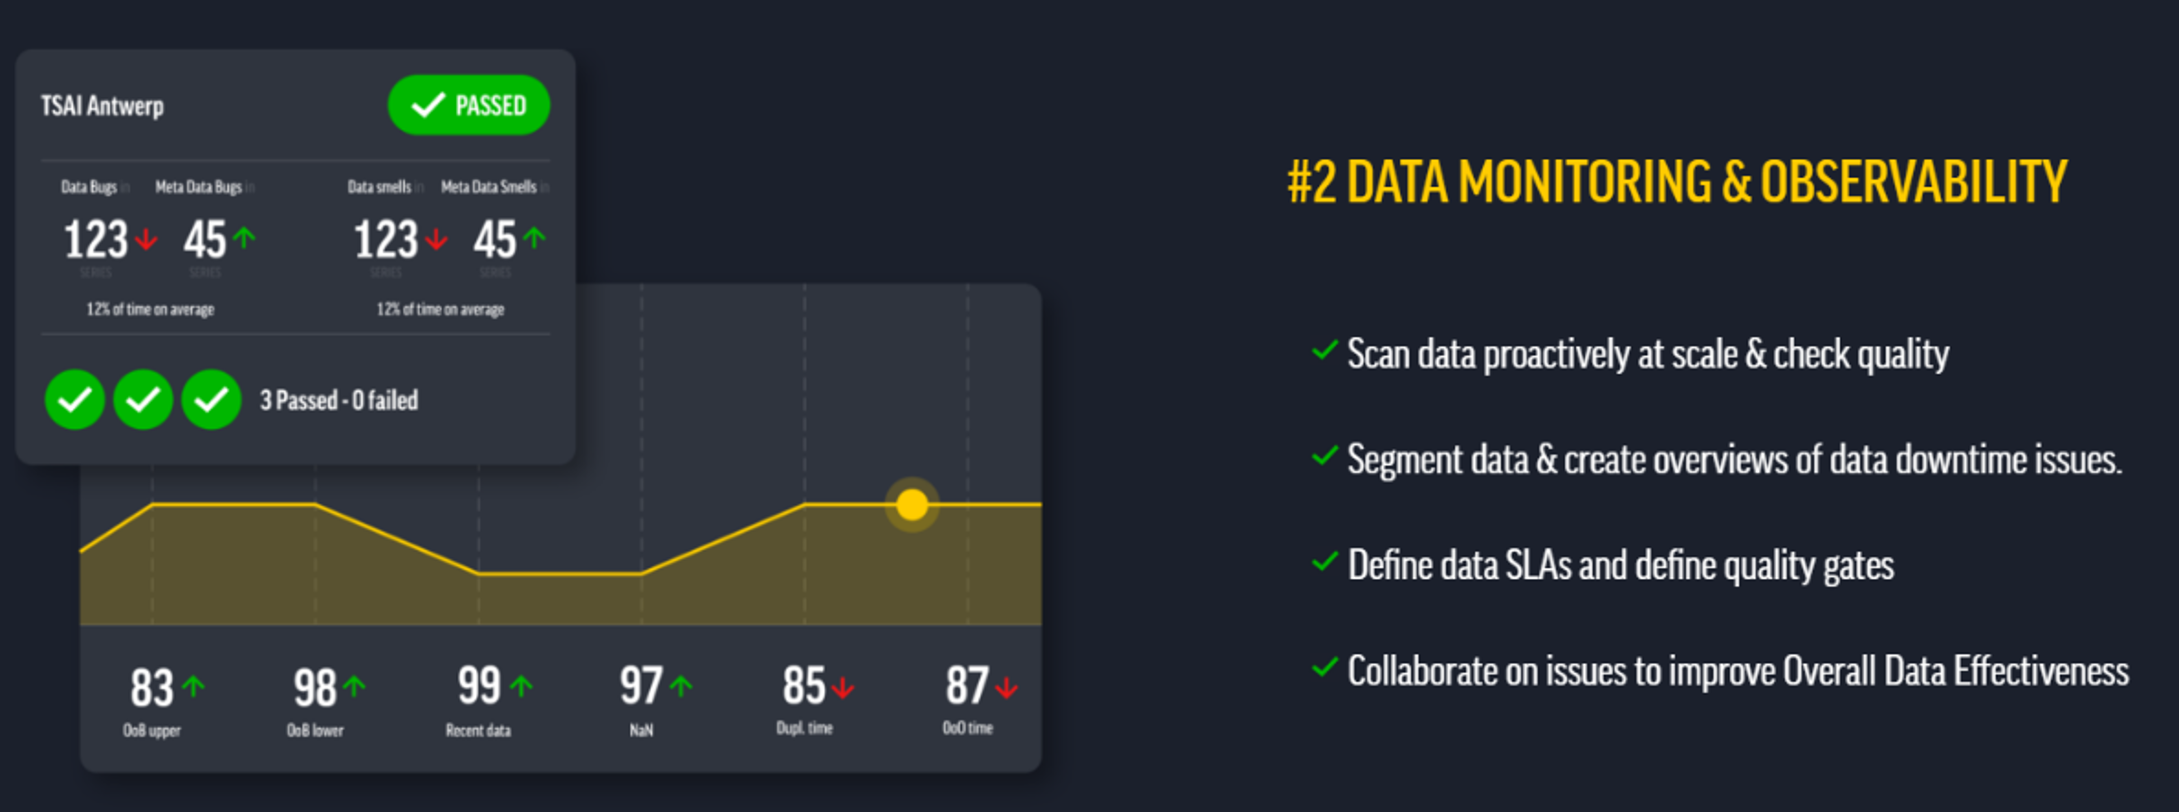
The next step is to proactively monitor the data at scale using the profiles and configured quality checks. Timeseer.AI enables users to define and configure different flows to validate time series against selected metrics and key performance indicators (KPIs). With over 100 quality checks available, the user interface provides extensive dashboards and graphs to visualize the validation results and the overall health of the time-series data.
3 Data quality optimization, augmentation and cleaning
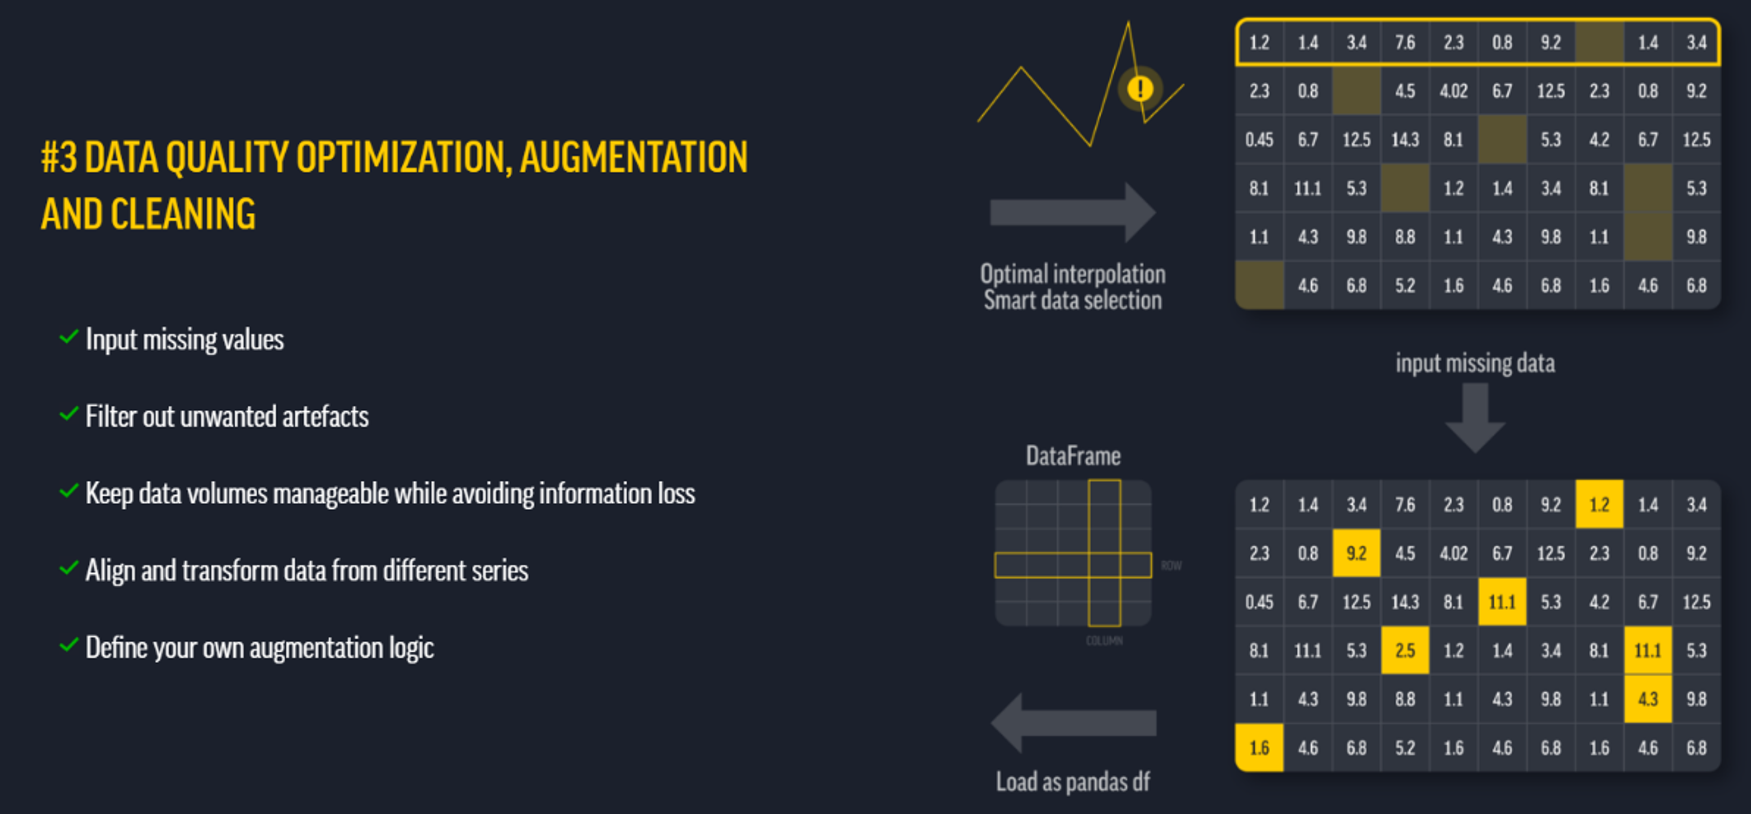
In addition to detecting and quantifying data quality issues, Timeseer.AI offers automated solutions to fix quality issues. Users can define custom policies to augment data by imputing missing values, filtering out unwanted artifacts, aligning data from different series, and more. This capability ensures that the data is reliable and ready for downstream analytics.
4 Data connectivity and uniformization
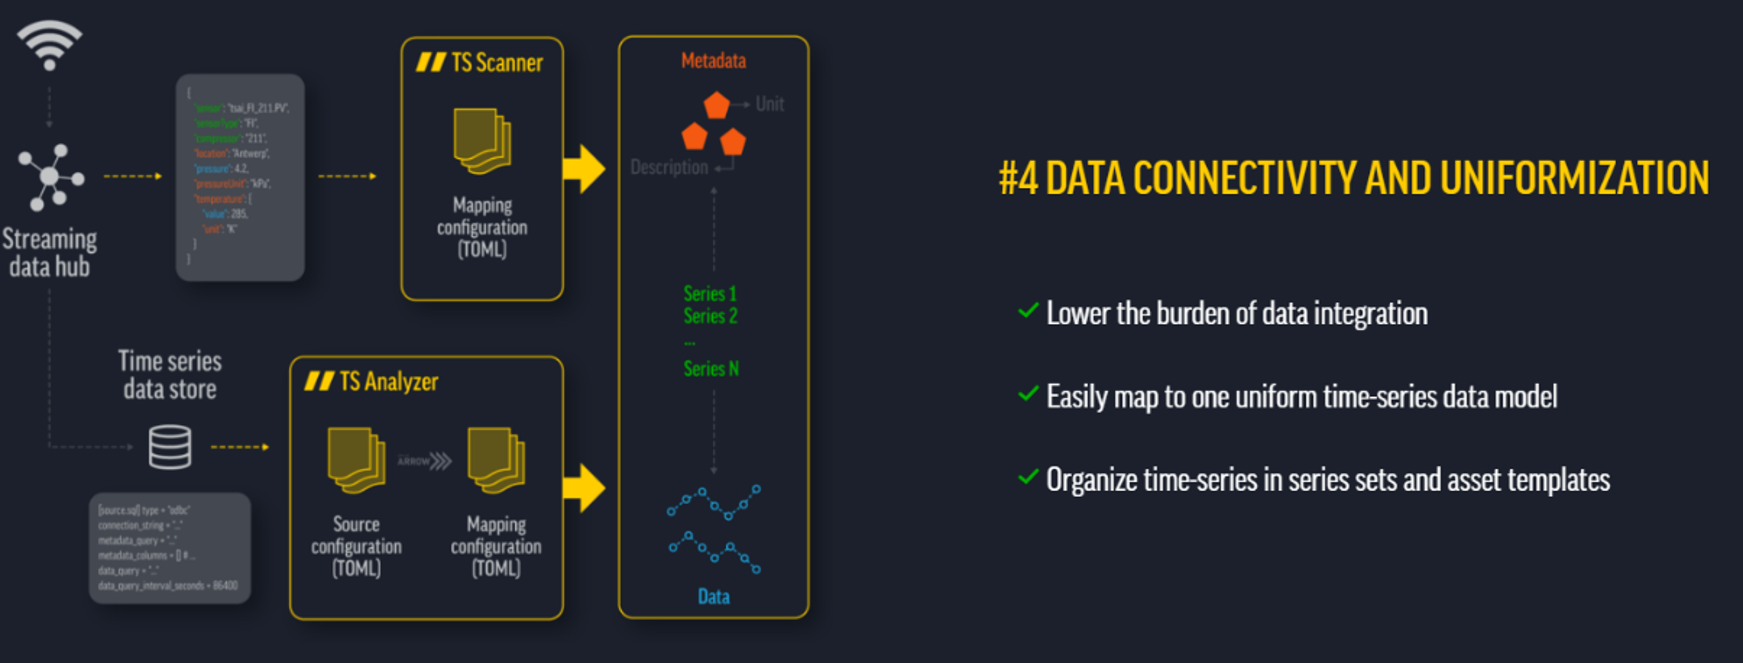
Timeseer.AI centralizes the profiling, monitoring, and repairing of time-series data in a single platform that can connect to various sources. By doing so, it reduces the burden of data integration and enables the mapping of all IoT data to a uniform time-series data model. Furthermore, the platform offers extensive configuration options to keep all time series and KPI assets organized.
How Timeseer.AI Works
Hosting & Access
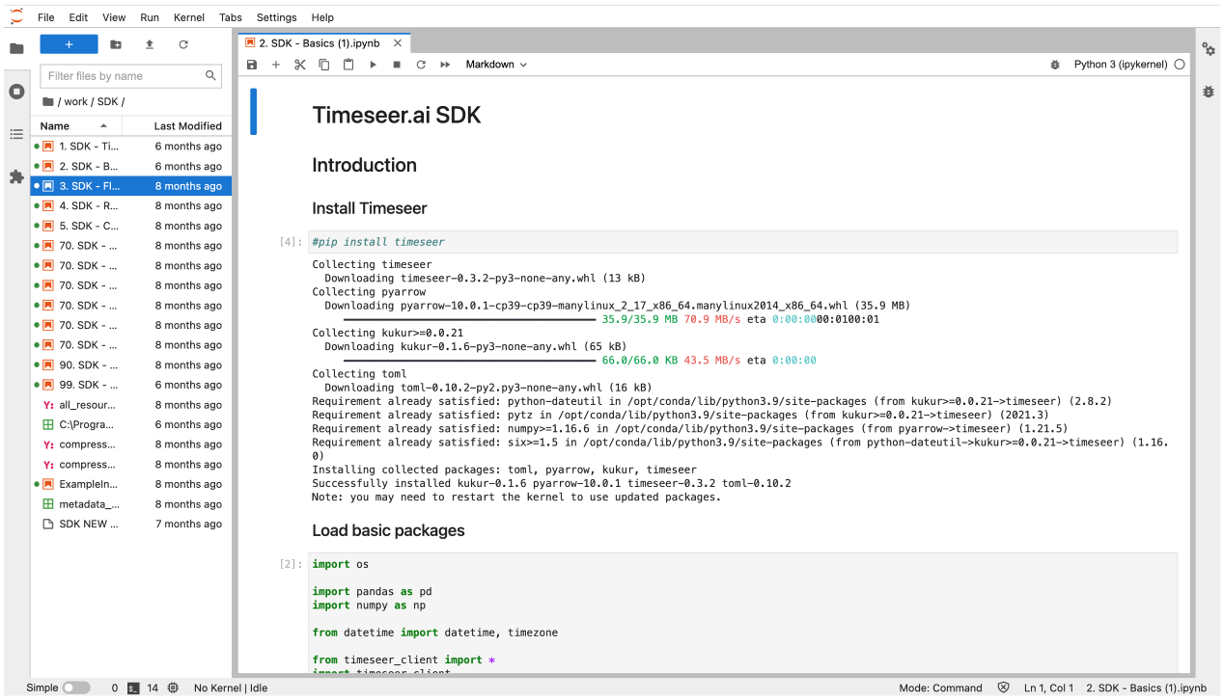
Timeseer.AI is a software platform that can be hosted on-premises or in the cloud. Stakeholders can access the platform through a web application UI or via a Python SDK.
The web app shows the dashboards and visualizations and is used for configuration while the Python SDK can be used for uploading and consuming data and enables even more configuration possibilities than the UI.
Components
Data Services
Data services are defined at the top level within Timeseer.AI. These projects are used for governance by isolating specific data, flows, or accesses for different users.
Connections & Data Sets
The software seamlessly integrates with a wide range of data sources, encompassing IoT lakes, time-series databases, historians, and streaming platforms. Each connection establishes a distinct data set within the platform so that within these data sets, the individual series can undergo comprehensive profiling, resulting in the assignment of calculated statistics. Additionally, various attributes can be assigned to the series, including upper and lower limits, sampling rates, units of measurement, and more.
Series Sets
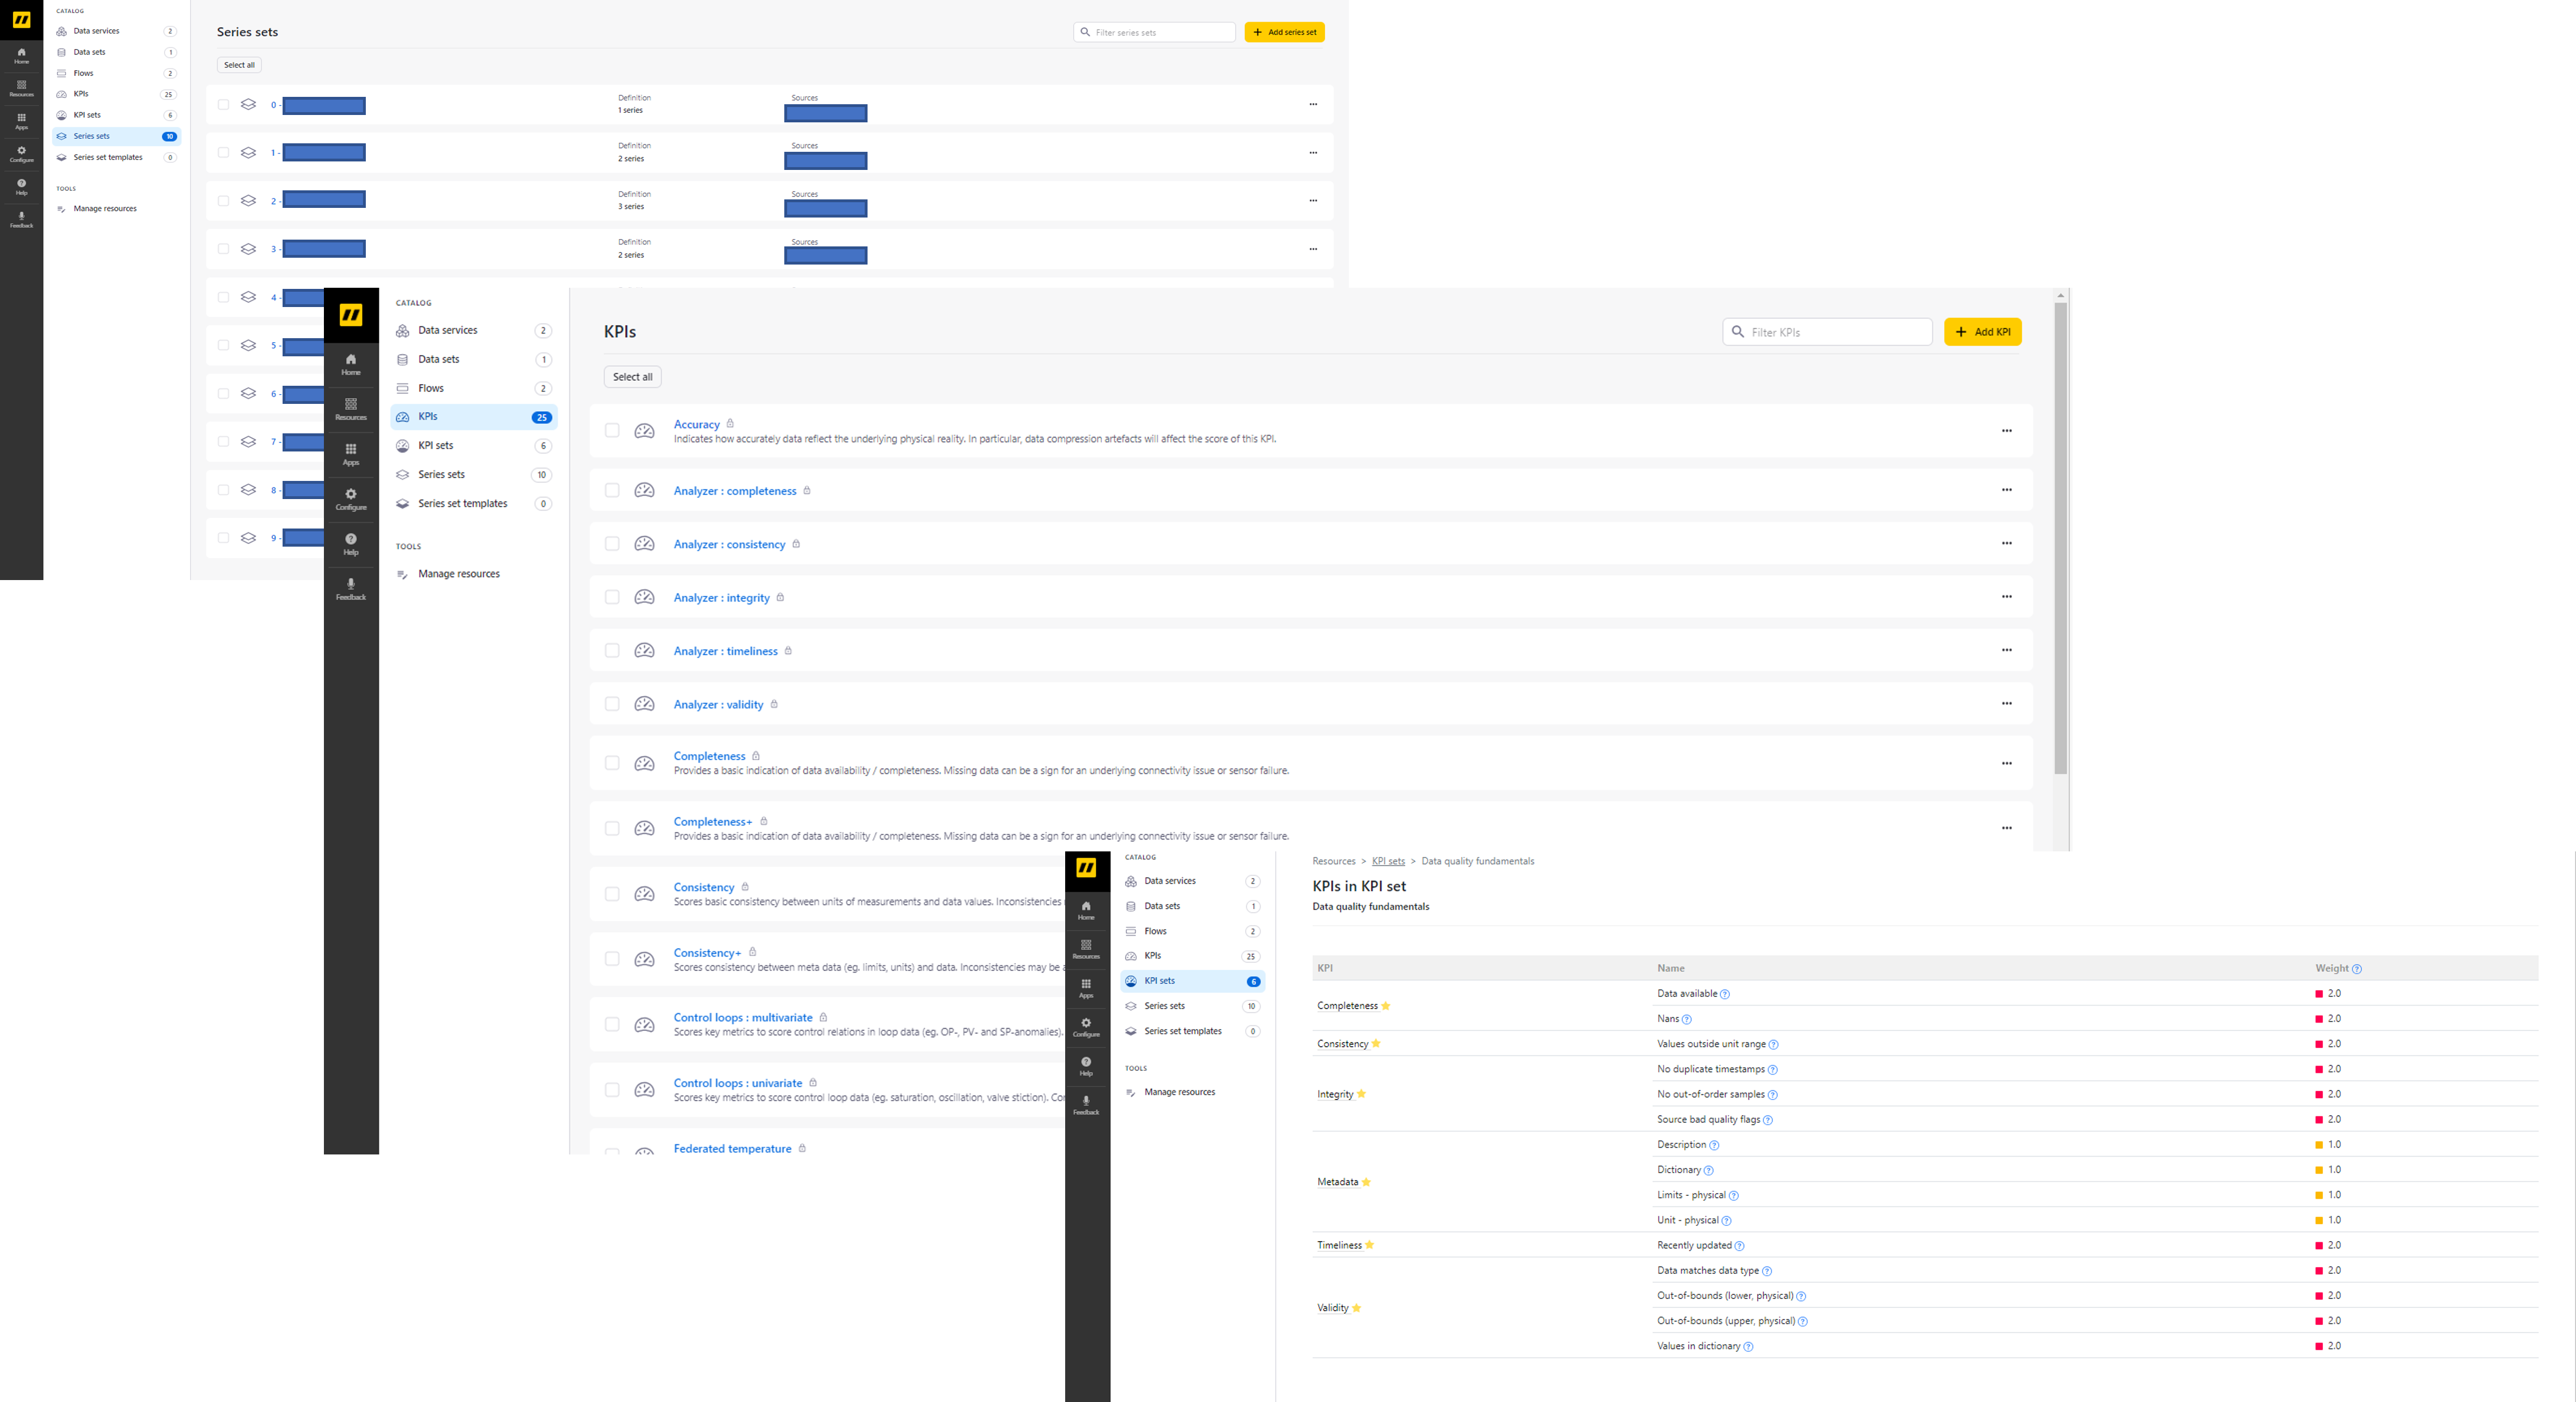
Timeseer.AI allows for easy organization and grouping of time-series data into series sets. These sets serve as collections of related time-series data that undergo validation against predefined KPI sets, thus providing a holistic assessment of data quality.
Scores, KPIs & KPI Sets
Within the Timeseer.AI platform, KPIs are defined as semantic collections of quality checks that collectively evaluate specific aspects of time-series data. With over 100 built-in quality checks, known as scores, distributed across 20 KPIs, users have extensive control over assessing data quality. Additionally, users can create their KPIs that are combined into KPI sets and populate these with custom quality checks tailored to their specific requirements. Again, built-in KPI sets are available, but users can create their own KPI sets, filling these with user KPIs.
Event Frames & Weights
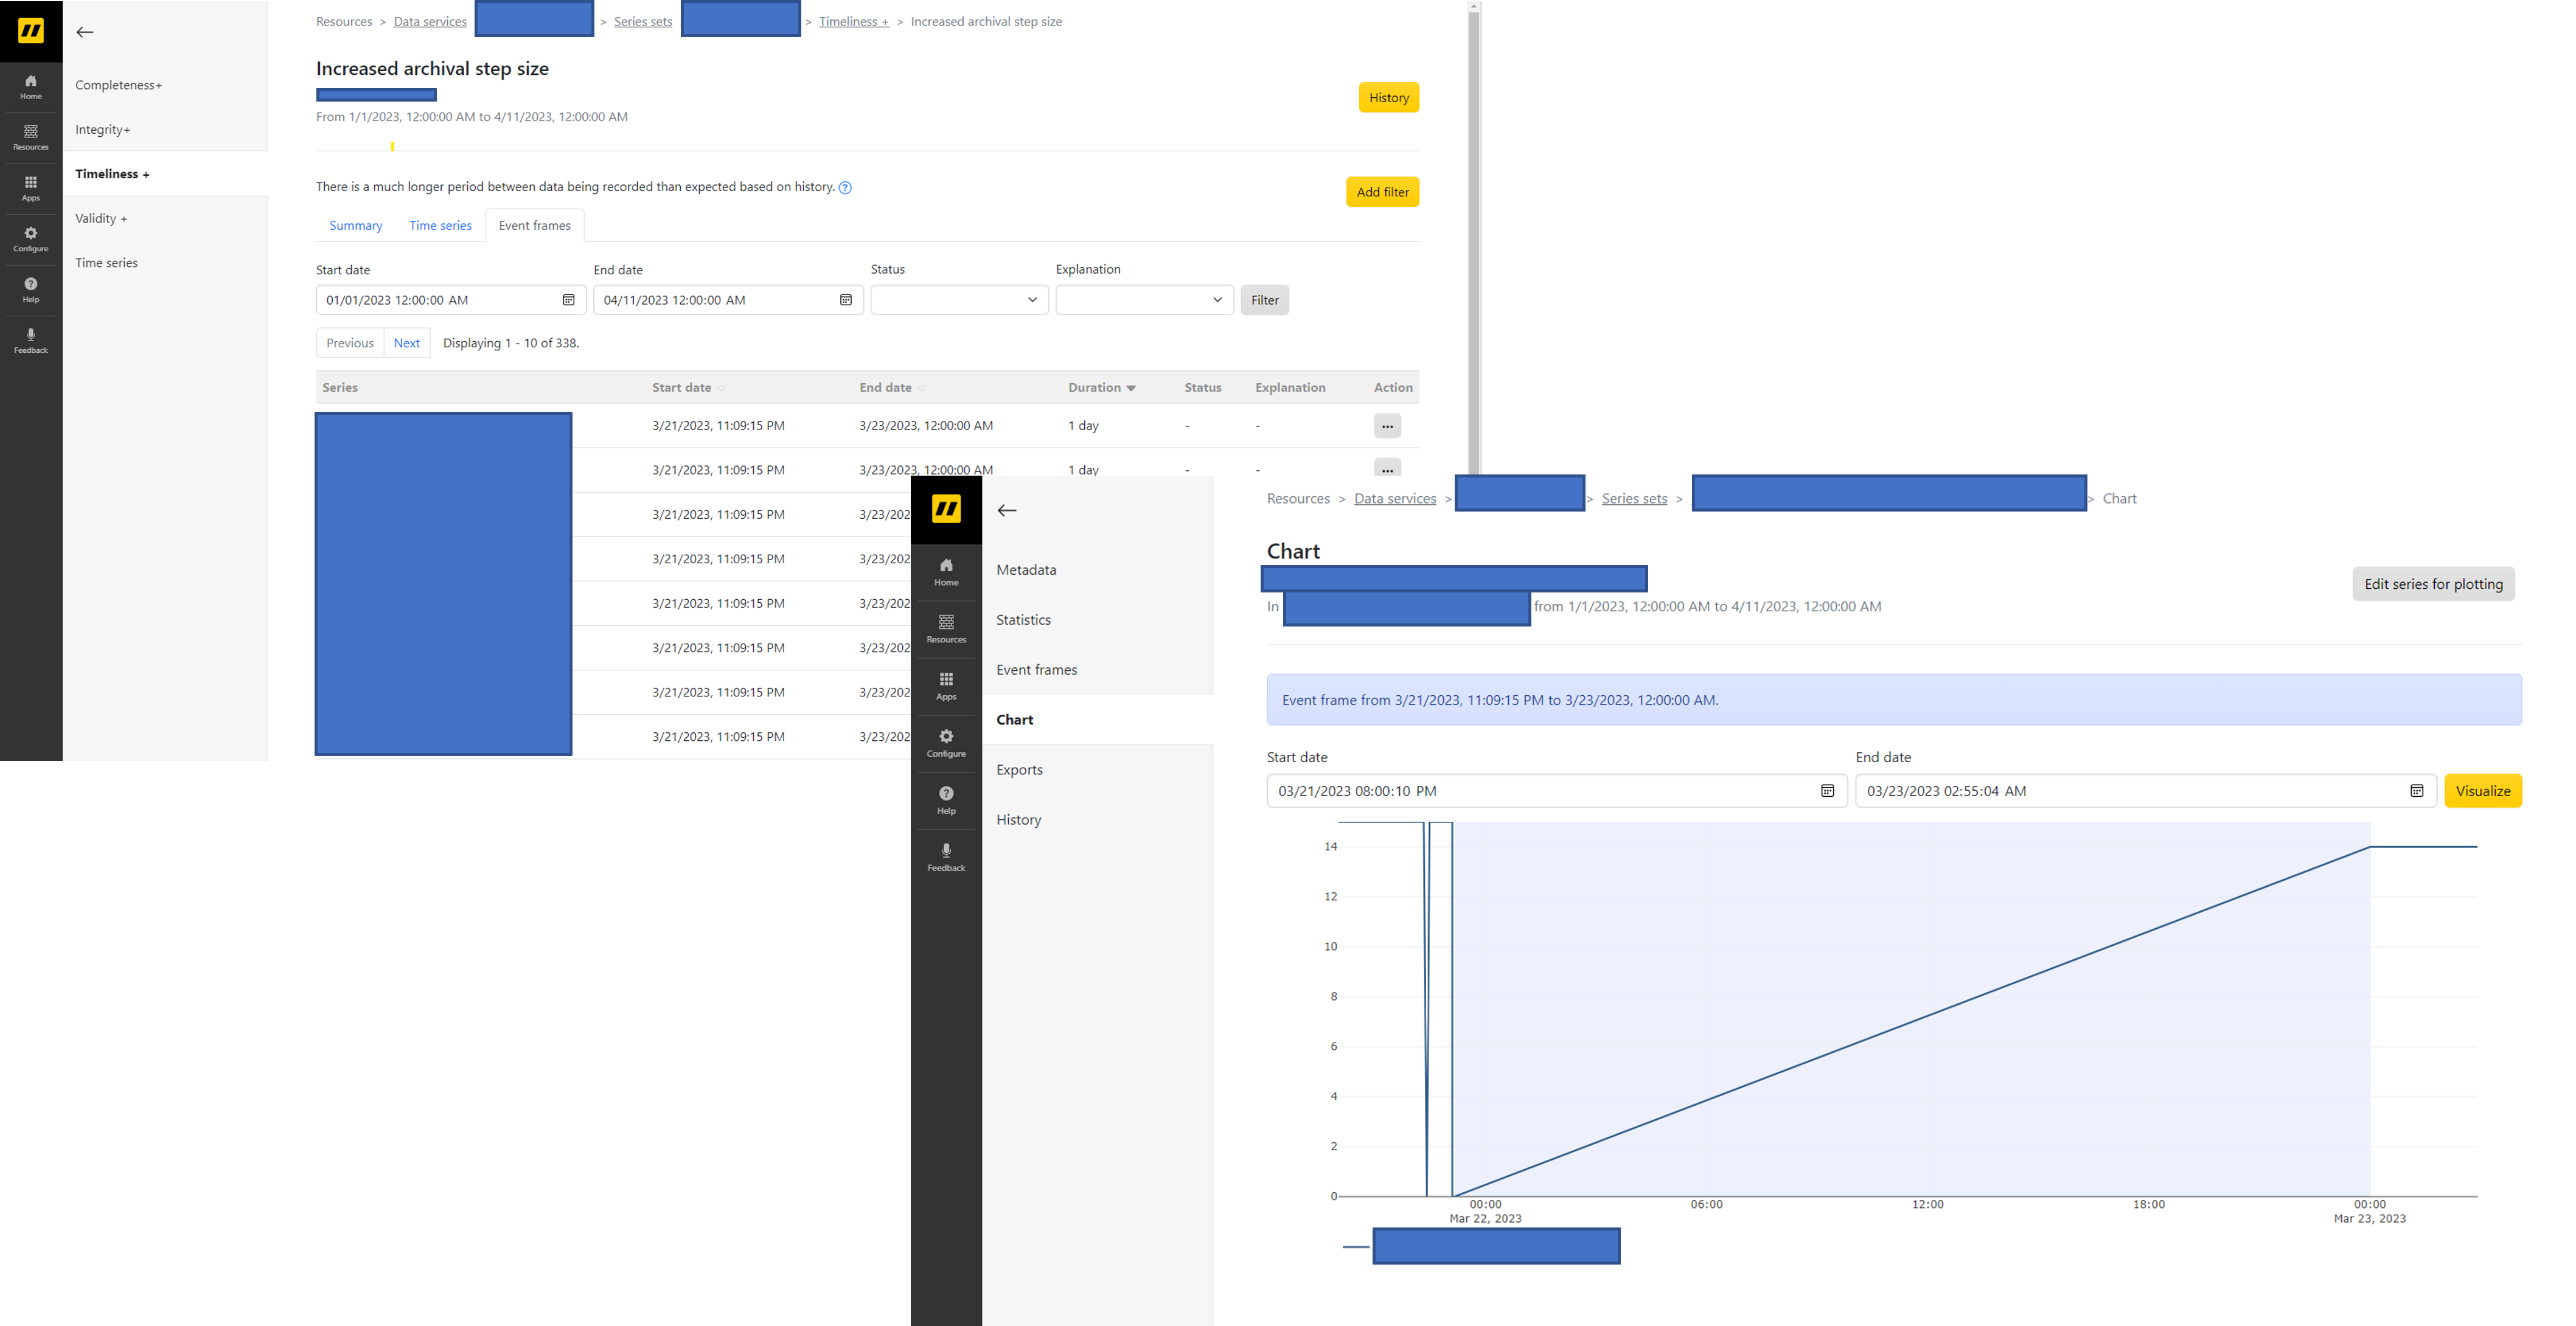
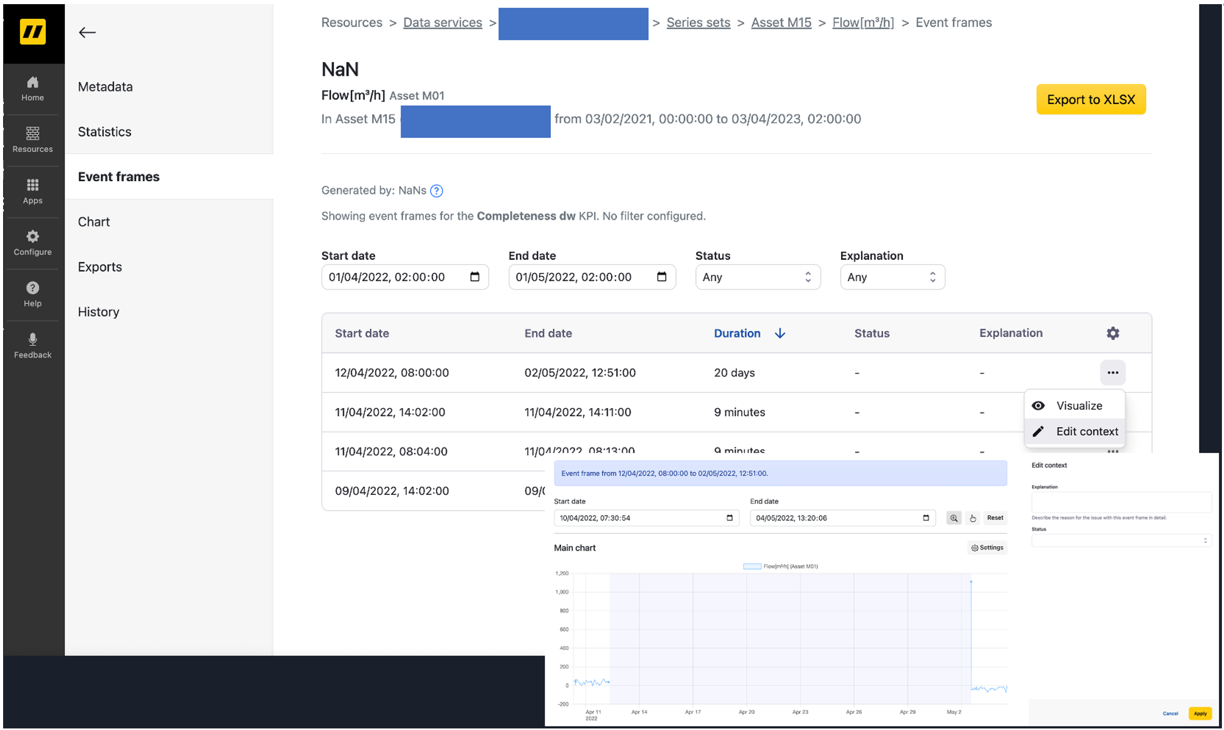
During the validation process, each time-series set is assigned a list of event frames that correspond to time intervals where the series fails quality checks. These event frames can be conveniently listed and visualized in the UI. To highlight the importance of each check, weights are assigned to scores that are represented by color codes on the dashboard.
Flows
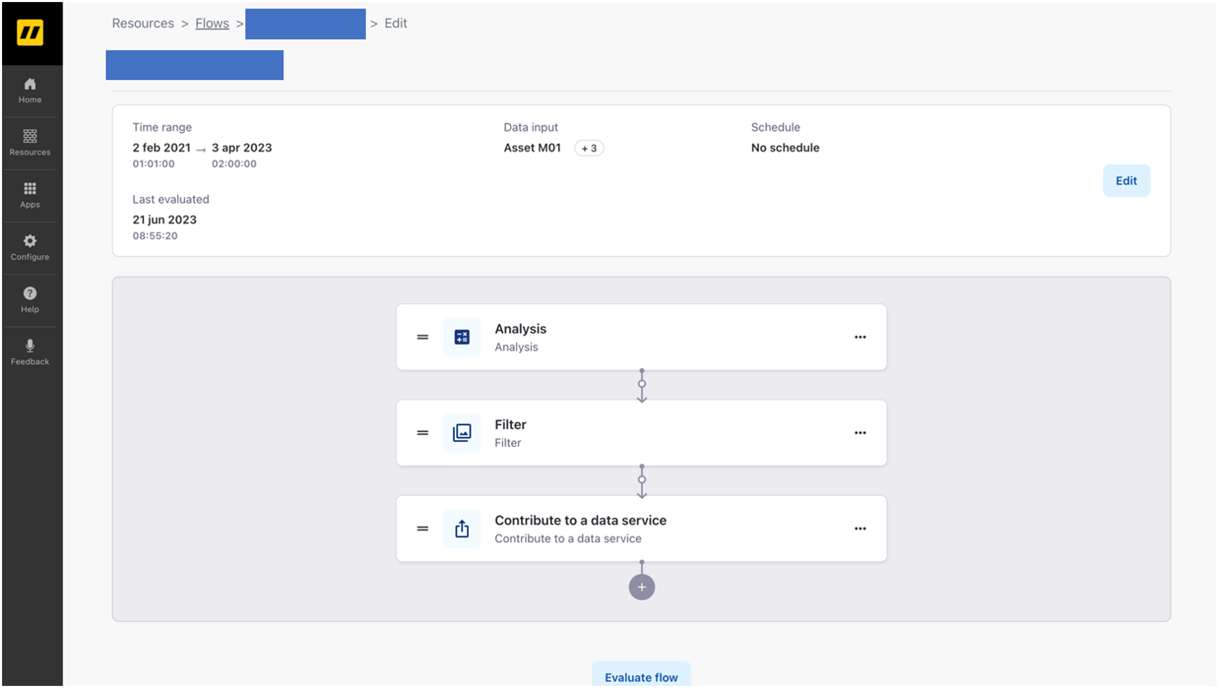
Timeseer.AI offers configurable flows, enabling users to execute a sequence of steps on their time-series data for augmentation or correction purposes. These versatile flows utilize various blocks such as data analysis, imputation, and filtering, among others. Executing flows results in clean, reliable datasets.
The Timeseer.AI Dashboard
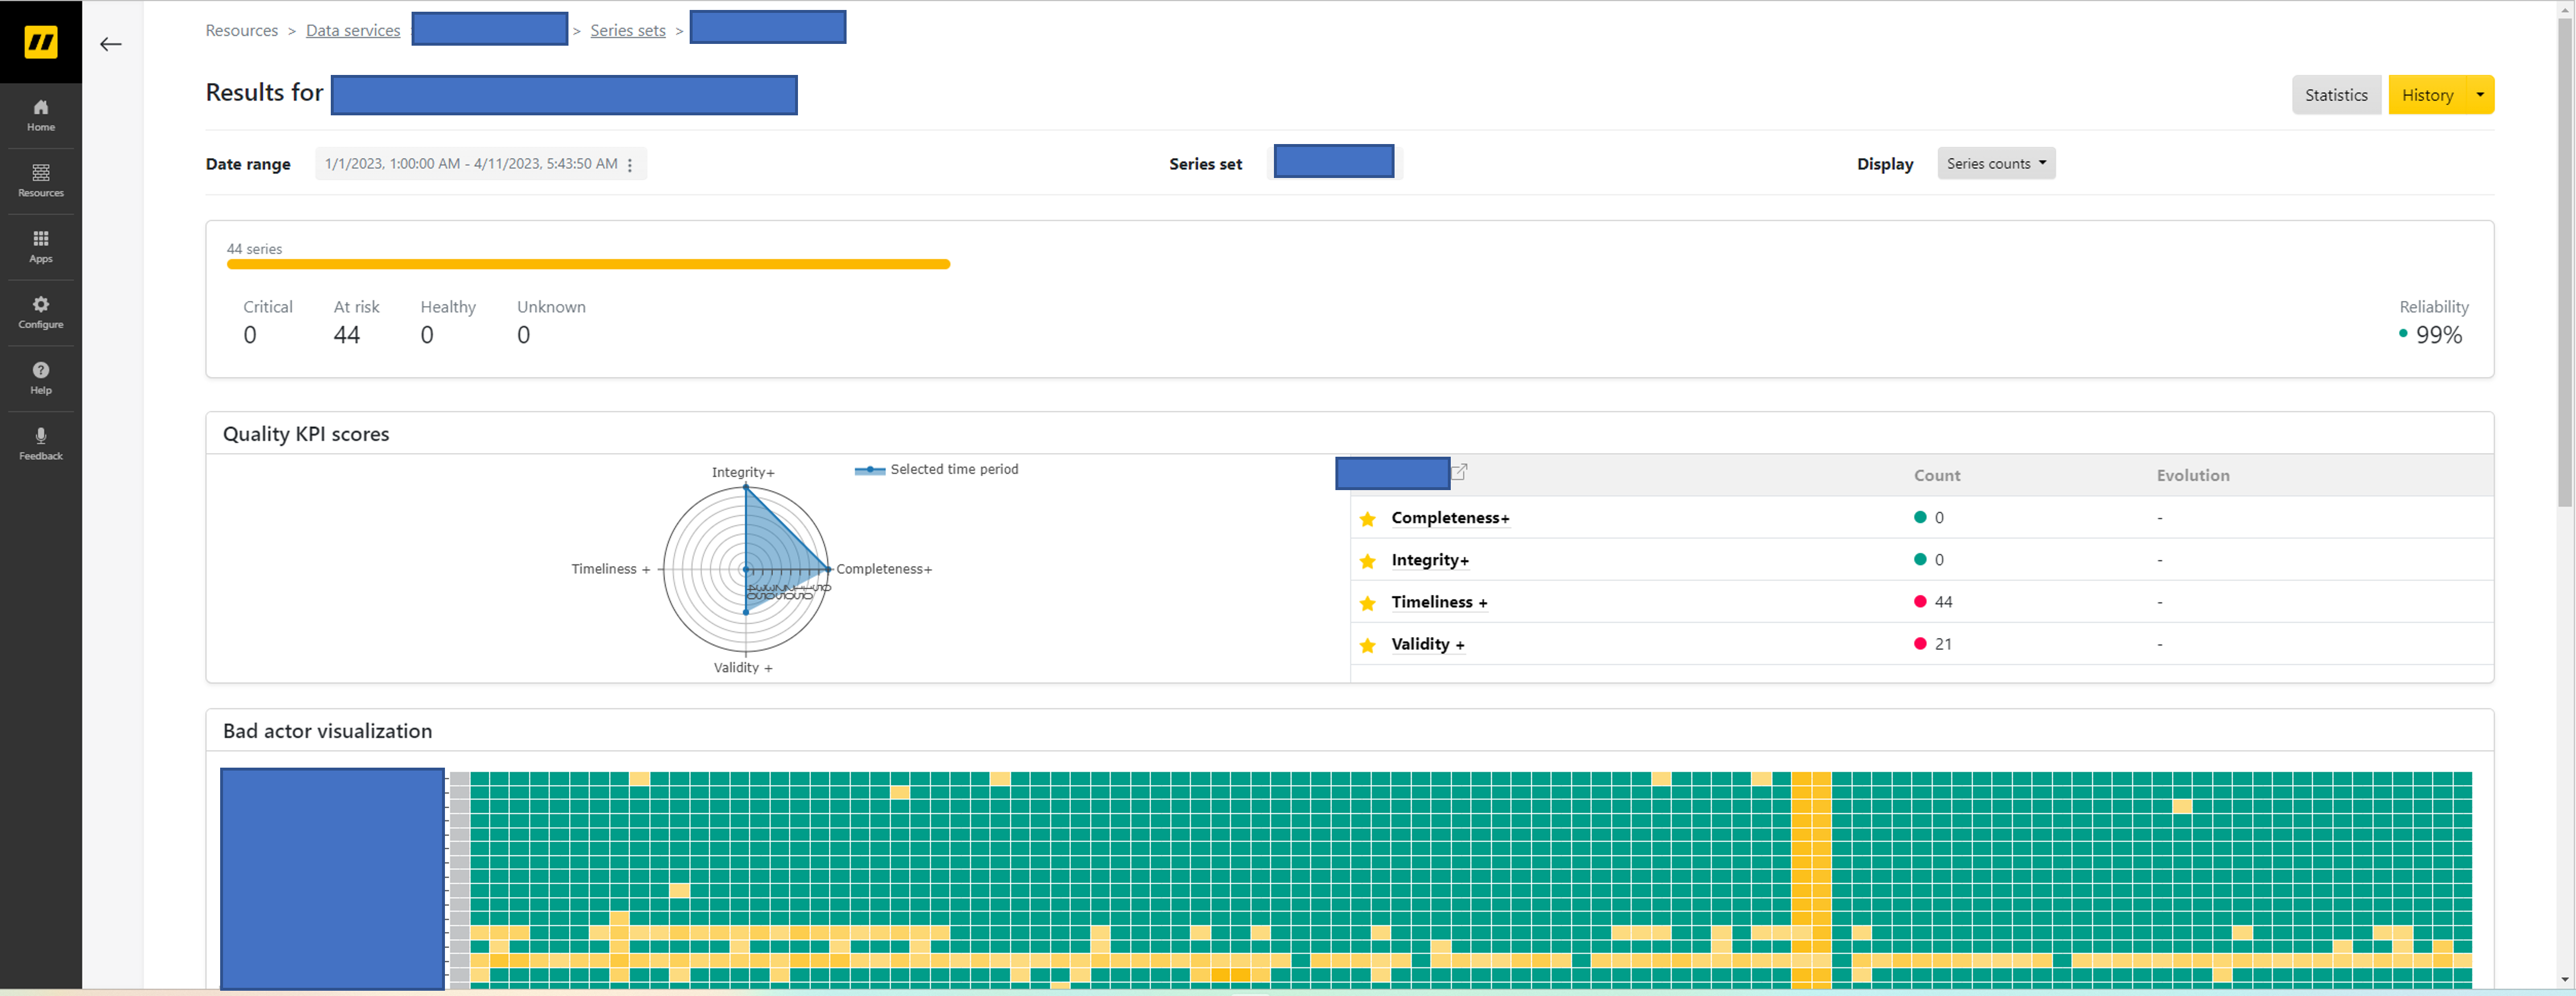
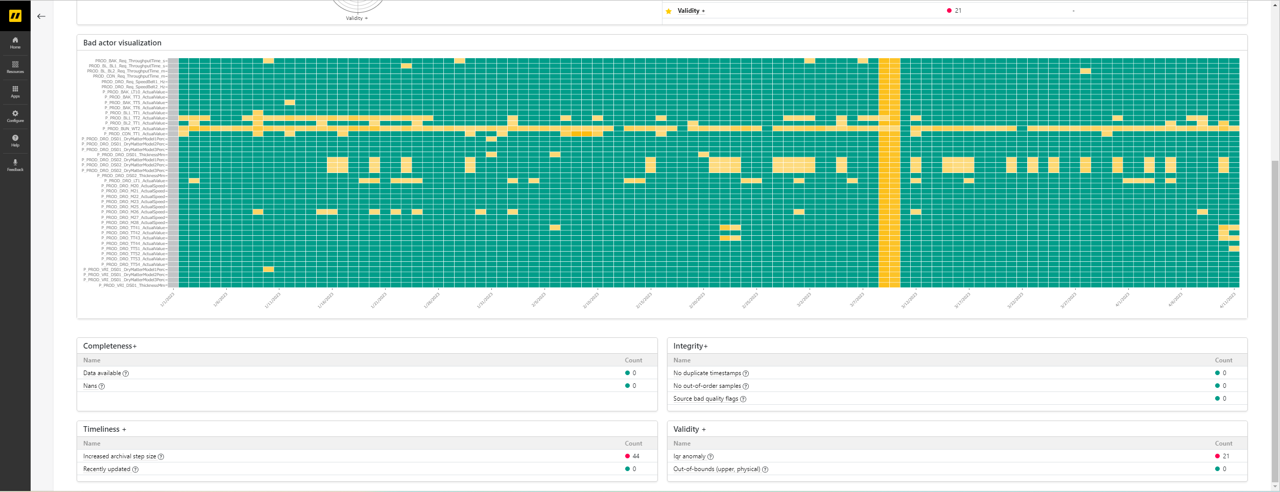
At the core of the user interface lies the Timeseer.AI dashboard that provides a comprehensive overview of time-series data health based on the defined KPI sets for a particular data service. The dashboard comprises several panels:
- The upper panel - displays the current data time interval and the series set used in the data service. Users can switch between the series counts view which shows the number of series that passed the checks and the scores view which shows the percentage of successful data.
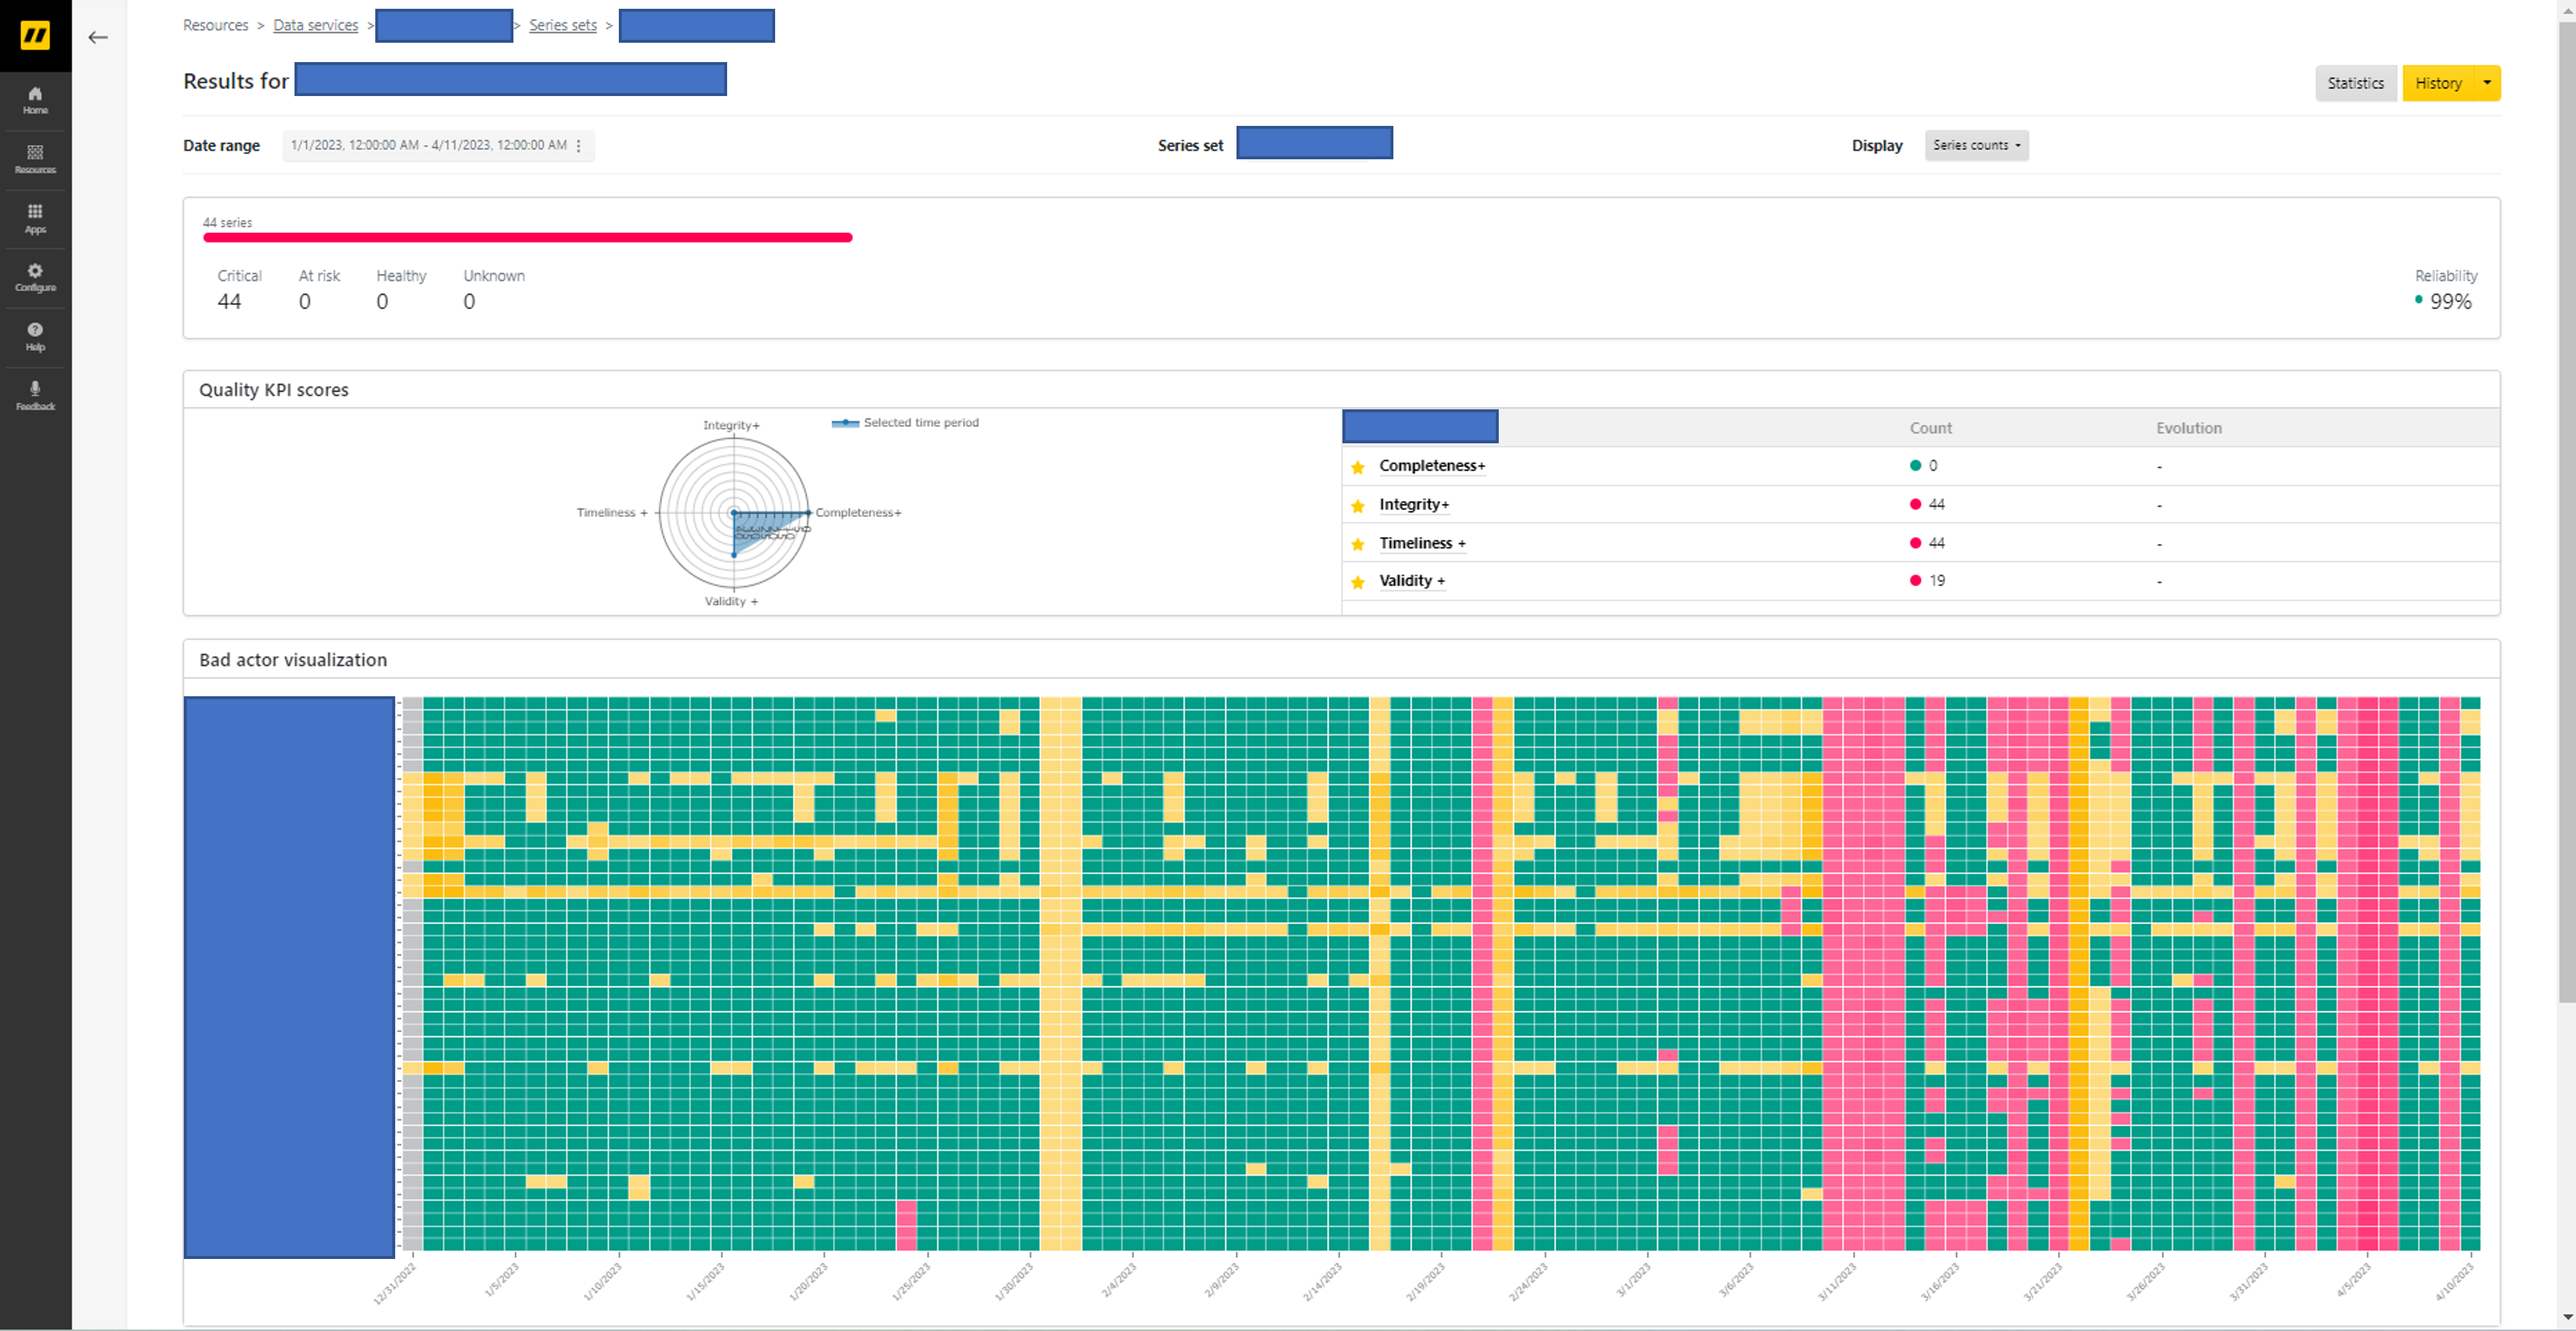
- The middle panel - includes a diagram illustrating the performance of the series set across different KPIs, offering a quick snapshot of data quality from various dimensions. This bad actor visualization panel presents a matrix view, with rows representing individual time-series data and columns representing days within the selected date range. Entries are color-coded, with green indicating all checks passed and yellow or red (based on weights) indicating failed checks for specific series on corresponding days. Users can easily navigate to detailed inspection of data quality issues by accessing event frames that can be visualized on graphs.
- The final panel - provides a list of configured checks, categorized by KPIs, along with the number of series that failed each check. In the scores mode, users can view the percentages of successful data per check, along with a table listing all checks and the corresponding scores per KPI.
An element61 Use Case on the Modern Data Platform
The value proposition of Timeseer.AI and its seamless integration into the Modern Data Platform on Microsoft Azure is best exemplified through a practical use case executed by element61 in collaboration with Timeseer.AI.
Optimizing Machine Parameters to Achieve Property Target
Imagine a company with production lines equipped with machines that continuously monitor various parameters, generating time-series data stored in a historian database. Additionally, sensors continually measure a specific target property of the produced items. The objective of this use case is to optimize the machine parameters to achieve as efficiently as possible a desired target value for the property.
To accomplish this, a machine learning model is trained to establish the relationship between the machine settings and the target property. By simulating the impact of changing specific machine settings, the model identifies the optimal settings that align with the desired objective.
Use Case Management Made Simple with the Modern Data Platform
From an engineering standpoint, the Modern Data Platform on Azure simplifies the management of this use case. The Azure Data Factory and Databricks are leveraged to ingest the historian data into the data lake, allowing cost-effective storage of the entire data history in Delta format instead of maintaining it on the historian servers. Moreover, master data, which encompasses information about production line activity and product types, is also copied to the data lake.

The data is collected centrally and is then processed by Databricks notebooks to create clean datasets suitable for training machine learning models. In our specific use case, we combine around 40 time-series sets with operational master data.
Data Science Challenges
However, the data science aspect of the use case often presents challenges. While the ultimate business value lies in developing accurate and reliable models, a substantial amount of time is typically devoted to preparing dependable datasets. This task involves filtering and cleaning the time-series data, which entails making difficult and somewhat subjective decisions about the data such as setting outlier thresholds, detecting sensor drift, and identifying inconsistencies in the sampling rate. These challenges are particularly pronounced when dealing with numerous interrelated time series that may exhibit correlations. This is precisely where Timeseer.AI excels.

Timeseer.AI Deployment Straightforward & Flexible
Deploying Timeseer.AI is straightforward and flexible. Deployment involves hosting Docker containers on an Azure VM, thus facilitating seamless integration with the existing network topology. After some system administration and configuration file setup, the platform is up and running. The Python SDK is installed via a PyPI package on the Databricks clusters. Then by creating a client using an SDK method and an API key generated in the UI, we gain access to Timeseer.AI and expedite our data science workflow.
Timeseer.AI can connect directly to the historian database. However, in our case, we utilize the SDK on Databricks to upload the data stored in the bronze Delta tables. This approach provides additional data quality checks, safeguarding against potential issues that may arise from data ingestion to the data lake such as code bugs or connectivity problems. Uploading a series is as simple as converting Spark data frames to pandas or pyarrow data frames and passing these as arguments to a method within our client object. Alternatively, Timeseer.AI can directly connect to the Delta tables on our Azure data lake.
Organizing the Data into Distinct Sets
Once inside the platform, we organize the series into distinct sets based on machine type to obtain a clear overview. We also define a KPI set tailored to our requirements. An examination of the KPI set reveals that none of the 44 data series achieves a perfect score across all metrics. A glance at the main dashboard already tells a simple story that the data is complete, but there are consistent issues with timeliness and integrity, which often affect all signals simultaneously.
Delving Deeper into the Data Quality Analysis to Reveal Data Issues
Utilizing visualization tools at our disposal, we can delve deeper into the analysis. One prominent challenge is missing data, where intervals between measurements sometimes extend from the expected recording frequency of every 5 seconds to hours or even days. Another subtle yet lesser-known issue among internal personnel is the presence of stale data. Although values are recorded at the anticipated frequency, these remain fixed for extended periods, whereas these should exhibit slight variations with each recording. Additionally, the platform identifies outliers, encompassing values that surpass configured physical limits, as well as values that deviate significantly from the global history of the respective time series.
Data Science & Operations Teams Address Data Issues
At this stage, the data science and operations teams come into play, collaboratively determining how to address the identified issues. This implementation involves creating a flow, primarily comprising filtering and interpolation blocks. Prolonged periods of corrupt data exceeding predetermined thresholds are filtered out, while smaller corrupted segments are interpolated using algorithms that best align with the underlying series values.
The final block of the flow entails publishing the cleansed data to the data service essentially generating a new, filtered, and reliable version of the dataset that can be accessed by the client on Databricks. Upon reviewing the dashboard and conducting subsequent checks after the completion of the cleaning flow, the reassuring sight awaits - the data errors have been corrected.
Moving forward, future data can be periodically ingested and cleansed using the established workflow applied to the initial dataset. With this solid foundation of data for our machine learning features, we can focus on feature engineering and model tuning, sparing ourselves the time-consuming process of manually assessing the quality of new data.
Timeseer.AI Key for Businesses to Leverage Time-Series Data
Timeseer.AI offers a platform-based solution for profiling, analyzing, and augmenting/repairing IoT data to significantly reduce the time required by data science teams to ensure data quality and prevent unreliable data from affecting operations. The software provides an extensive array of capabilities for visualizing and resolving data quality issues, offering configurability through a well-defined set of components.
Furthermore, Timeseer.AI seamlessly integrates into the Modern Data Platform on Microsoft Azure, boasting flexible deployment options, effortless programmatic access to Databricks, data lakes, and on-premises databases, along with a streamlined UI experience. These features empower data science and operations teams to swiftly regain control over the quality of their IoT data, making it an invaluable asset for companies seeking to leverage reliable time-series data for crucial business insights and state-of-the-art use cases.


