What is the Power Platform
Power BI is a key component of the Power Platform, integrated into the Microsoft 365 suite. In addition to Power BI, three other essential tools complete the Power Platform: Power Automate, Power Apps, and Power Virtual Agent. Combined, these four tools create a robust platform, empowering you to develop your business applications and gain valuable business insights. While each app possesses its level of maturity independently, its collective strength truly emerges when utilized together within the Power Platform. Power BI is also integrated into Microsoft Fabric. Fabric is the platform recently announced by Microsoft that will host a lot of data-driven Microsoft applications.
This Insight will discuss how to effectively use Power BI within the Power Platform by highlighting each component and showcasing integration examples.
What are the components of the Power Platform
Power BI

Among the applications within the Power Platform, Power BI stands out as the most widely recognized. This self-service tool for initiating data analysis has recently gained significant popularity. With Power BI, you can quickly generate reports from various data sources.
Power Automate

Power Automate, previously known as Microsoft Flow, is an automation tool that allows you to connect various applications and services. Numerous connectors are available within Power Automate, ranging from Sharepoint and Outlook to Power Apps and Power BI, making it an incredibly versatile platform.
Power Automate is like a conductor for Power Platform. It performs various steps based on an action, moving data, requesting approvals, and automatically saving documents.
All data connectors: Connector reference overview.
Power Apps

Microsoft's Power Apps is a low-code solution for creating applications. There are two primary formats in which you can structure Power Apps: a canvas app and a model-driven application.
A canvas app starts with a blank canvas, allowing you to arrange elements such as photos, buttons, tables, and galleries as per your preference. You also choose the data source from the list provided with Power Automate, enabling you to build your app with personalized data. On the other hand, a model-driven application is built on Dataverse (formerly known as the Common Data Service). This approach may offer slightly less flexibility in terms of design than a canvas app, but it excels in leveraging predefined lists. Users can efficiently manage data by seamlessly consulting these lists, and selecting records to modify or initiate the creation of new ones.
Overview
| Category | Model-driven apps | Canvas apps |
| Data Platform | Dataverse only | Dataverse + many others use connectors |
| Design experience | No-code component-focused design | Manipulation of control properties using Power Fx expressions |
| UI control | Limited, predominantly customization | Full control |
| App consistency | High – differs predominantly based on the tables and views chosen | Often low, given the significant control the designers have of the user experience |
| Migration between environments | Simple | Potentially complex given that the data sources may need to be updated |
| Speed of creation | Rapid | Relative to the complexity of the design |
| Responsive | Automatically responsive | Only responsive if designed in this way |
| Navigation through relationships | Automatic, provided relationships exist | Only where designed and applied using Power Fx formulas |
| Accessibility features | Built-in | Designed into the app: Create accessible canvas apps |
Source: What are model-driven apps in Power Apps?
Now that we have established the baseline… Let’s dive into some powerful use cases
Notify via email upon reaching Power BI KPI
This use case offers a significant advantage to your business decision-making process, allowing you to respond quickly when data deviates from the normal state of your operations. The strength of this scenario lies in its versatility, as the connector can be applied to every KPI (if it has an alerting linked to it) in your reporting.
By linking the flow with an alert, you can prompt key users to take action or let Power Automate execute some other steps provided by the platform.
Here's a practical example of how this use case can play out in a business setting:
Let's say a KPI in Power BI indicates a negative value for the on-hand inventory of a specific product. With the integration of Power Automate, an email can be automatically generated and sent to the Purchase department. This alert empowers the department to promptly check if a new order is necessary, facilitating a swift and proactive response to inventory issues.
How do you set up this use case
When navigating to the Power Automate website, we see a lot of components on the left menu. One of them is "Templates"; these are predefined templates by Microsoft that contain the "code" for a small business use case. Power BI can be used in Power Automate in many ways. It can be used as a trigger for a flow or the end of a flow to create a result. For example, a flow in Power Automate can generate a new line in a Power BI dataset.
To implement the use case, we will navigate to "Templates" on the left-hand side of the screen and enter "Power BI" in the search box.
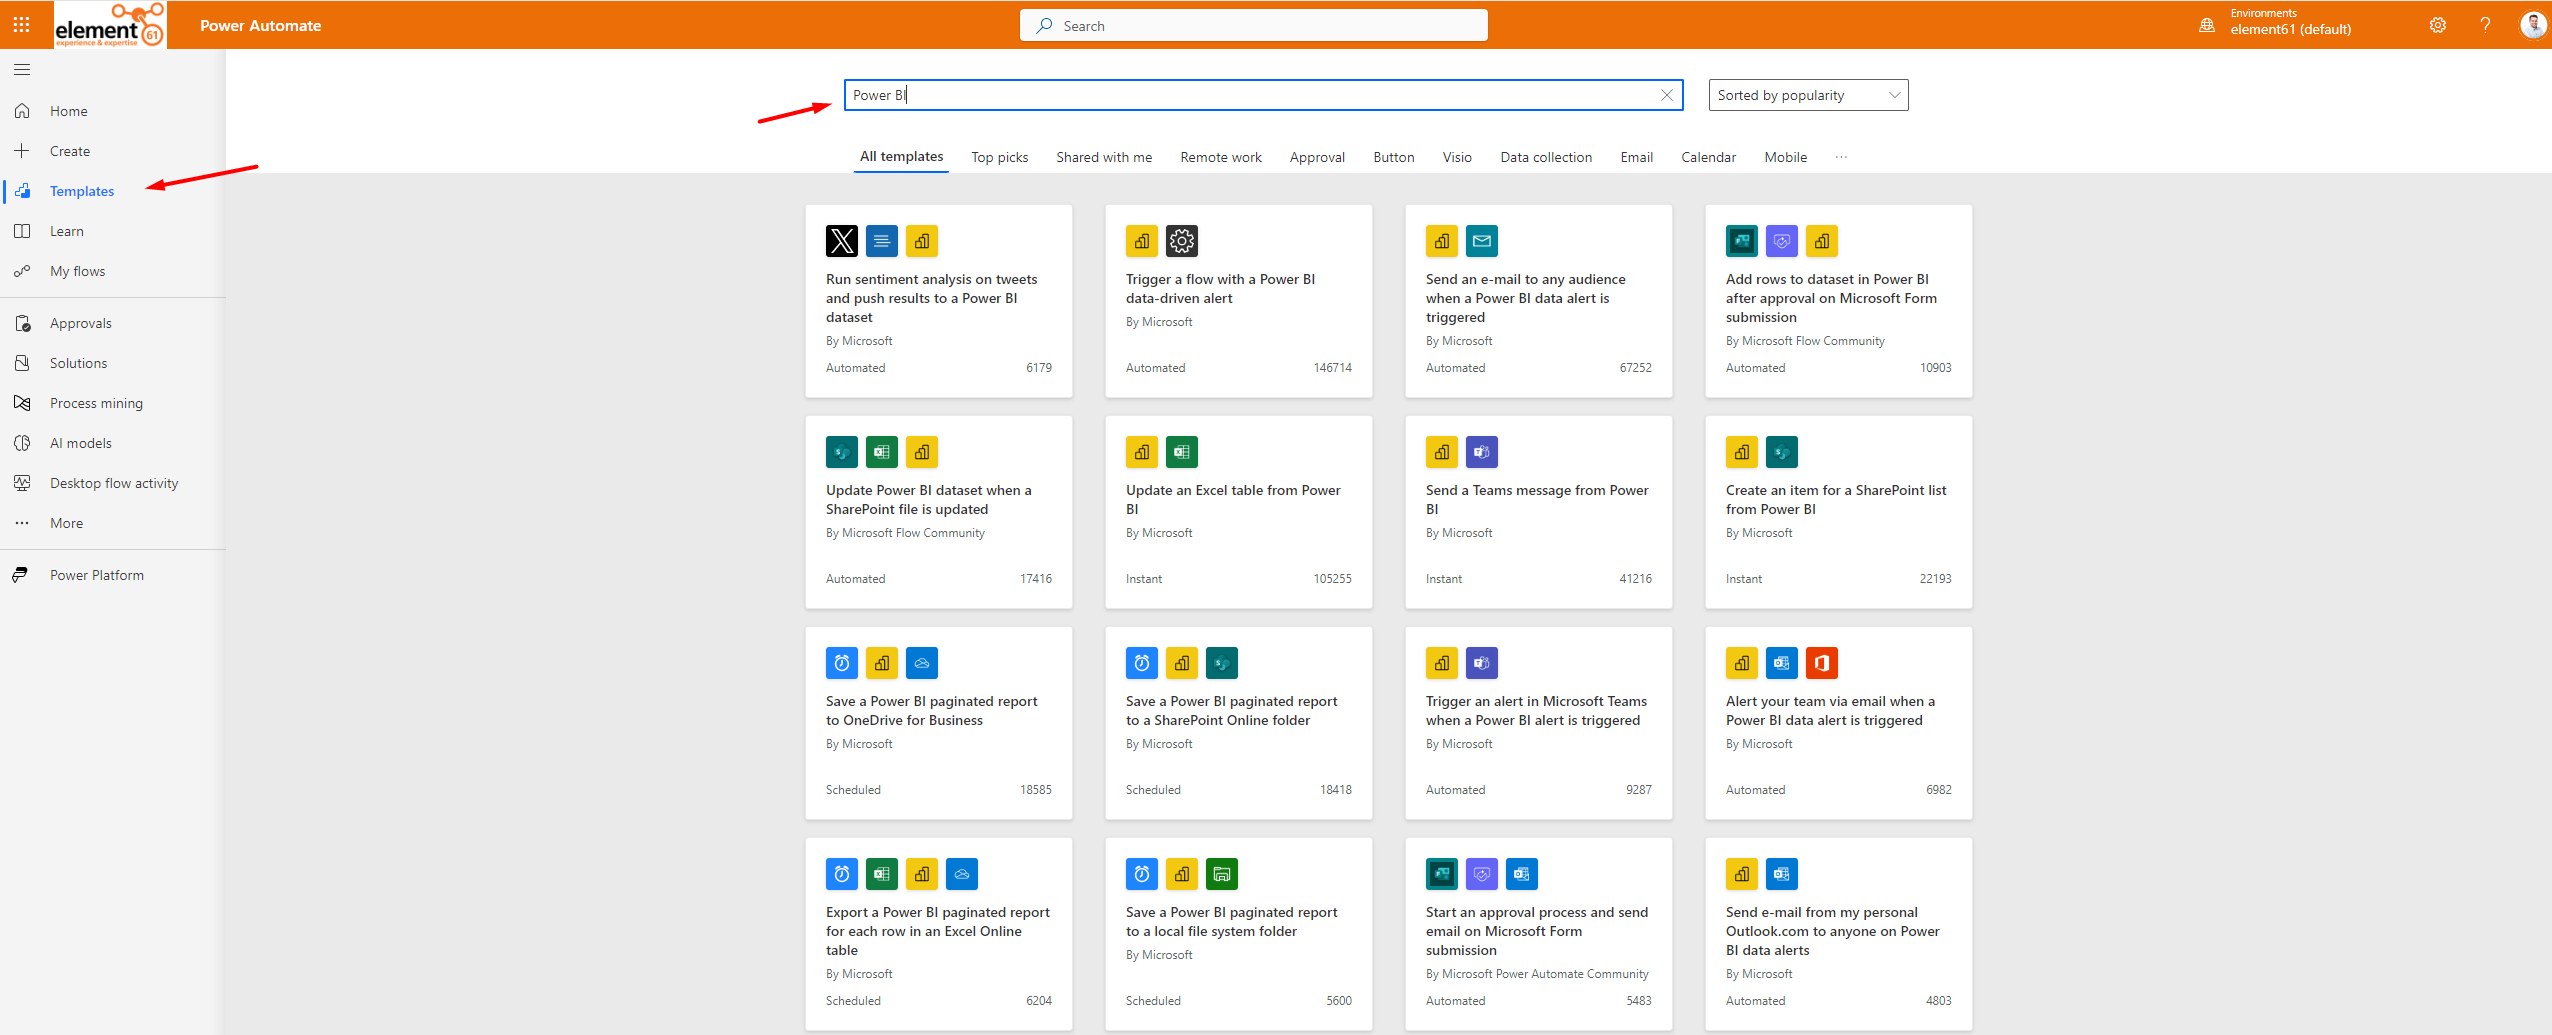
There are some exciting templates available to use. For this use case, we will be sending an email to any intended audience when a Power BI data alert is triggered. To accomplish this, you will need to complete the connectors with the correct data by clicking "Create" next to the connector icon and then clicking "Continue".

Then, you get a screen where the template flow is supplemented with standard information. In the first block "When a data-driven alert is triggered", you can start choosing the data alert. More information on how to create a data alert can be found here: Data alerts in the Power BI service.

In the next block of the "Send an email" flow, you choose the recipients of the email, the people who should be notified of the data alert. In addition, you can freely start changing the subject and body of the mail to your own preference.

When you have finished this step, you can save the flow and start testing it.

As soon as the data in the tile on the dashboard exceeds the value, the person receives the e-mail below with the value of the measurement, the maximum limit and the link to the object in the Power BI service. This allows the key users to act immediately where necessary.

Data entry with Power Apps in Power BI reports
This use case is for sales reps who need to make frequent visits. We want to consult, complete, and modify orders while having a brief overview of the global sales figures. The solution needs to be user-friendly and cannot involve changing applications due to the limited time of the sales representative. The sales representative also needs to see the updated reporting immediately for his subsequent visits to follow his numbers during the day. We have created a simplified solution for this use case to help the sales representative improve productivity.
For this use case, we need a couple of components to create the solution:
- Excel on OneDrive with sample data
- A Power App generated from the sample data
- Power BI Desktop
Setting up the components
For this exercise, I created a table in Excel with some lines of example data. This use case involves the sales of a small fictitious sports shop. After creating the table, I saved the file to my OneDrive. This is a resource that Power Apps can easily use to start generating an app on.
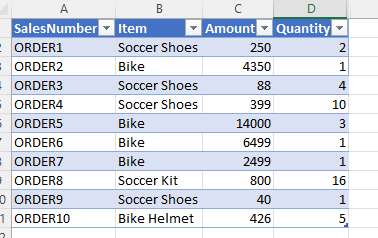
Once this Excel is saved, we can start creating the Power App. We can do this by going to the Power App website and signing up. On the home screen, we see "Create" on the left side, this tab allows us to start generating an app from a file on our OneDrive. To do this, we are going to select "SharePoint".

Then, we choose "OneDrive for Business" and select our saved file.

The app is automatically created with a drop-down list, a details screen and a screen where we can make adjustments as well as start creating new lines.
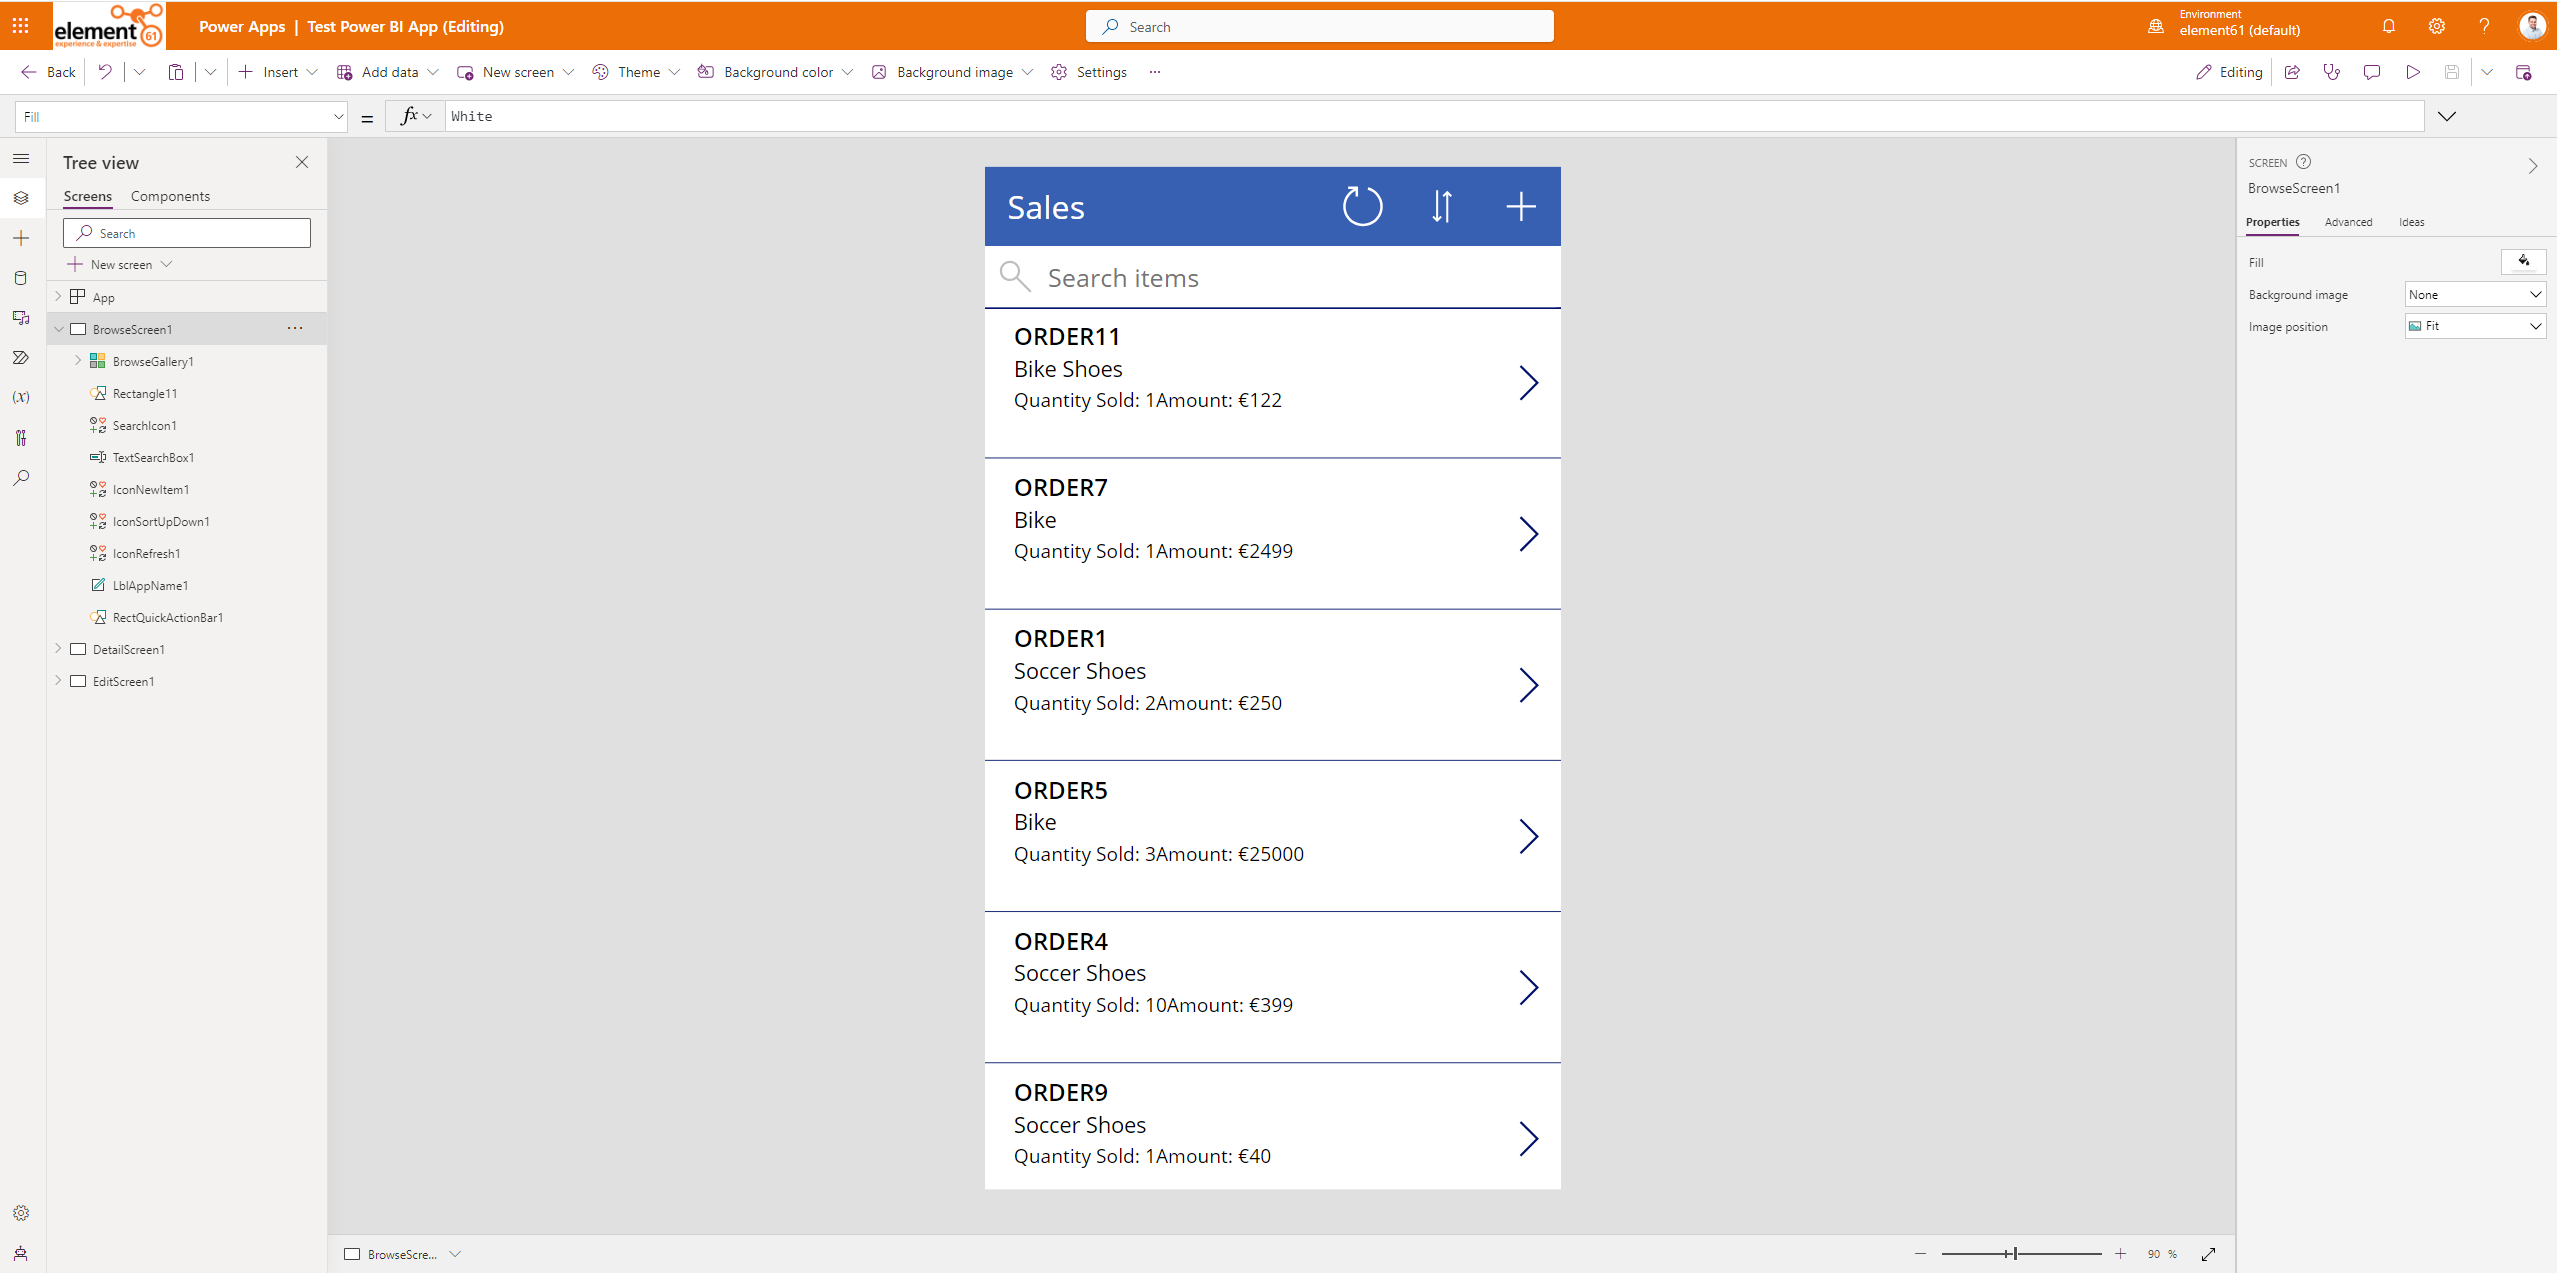
We click the "Save" button and give our app an appropriate name. Now we can start using it in our Power BI reports.
Creating the Power BI report
In Power BI Desktop, we will first start retrieving our data from the table we created in Excel. We do this by choosing the "Excel Workbook" button in the ribbon. Then we will look for the Excel file in our OneDrive and select the appropriate table.

You will see that Power Apps has added a column with a unique identifier to it.
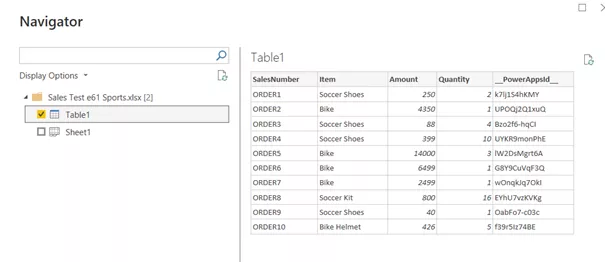
Then, we can put some visualizations on the canvas.
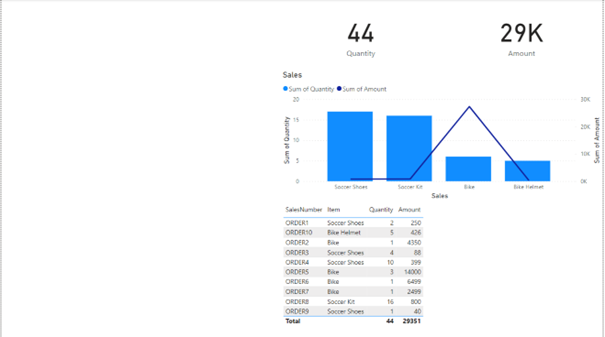
When you look at the various visuals, you will see the Power Apps logo. When we place it on the canvas, we see how to start copying the data. I will place the unique identifier in the data field in this demo.

In the visual itself, we choose "Choose App" since we have already created it and select the app created in the next screen. This result is the same drop-down list we generated in the Power Apps portal.
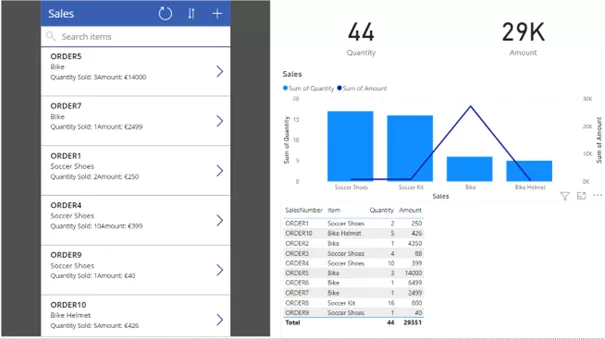
The app is now linked to the report and can be used. When the adjustments in the app are done, you can refresh the data and the visuals will be updated with the adjustments made in the app. For example, here I will adjust the price of Order 5 and create a new order.
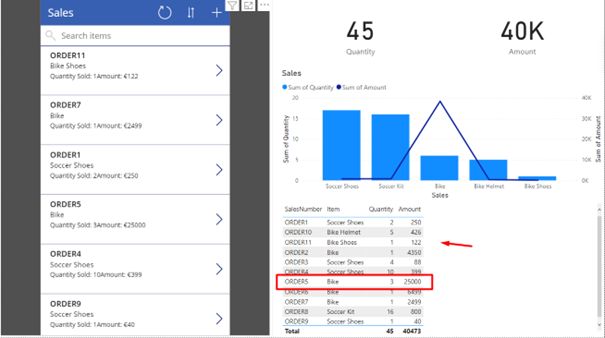
All the visuals are updated with the new amounts and quantities.
What is the conclusion
The Power Platform and its diverse set of tools offer many solutions for a wide array of business processes. This versatility stems from the ability to customize solutions based on specific use cases and the seamless integration between all the tools. In this narrative, Power BI takes on a pivotal role. Initially, it serves as a tool for visualizing data. However, it goes beyond that by acting as the starting point — triggering actions (such as alarms) for subsequent steps. Moreover, in conjunction with Power Apps, Power BI becomes a valuable input method, facilitating data generation to enrich the overall process further.


