Introduction
Microsoft Fabric is the new Microsoft branded analytics platform that integrates data warehousing, data integration and orchestration, data engineering, data science, real-time analytics, and business intelligence into a single product. This new one-stop shop for analytics brings a set of innovative features and capabilities by providing a transformative tool for data professionals and business users. With Microsoft Fabric, you can leverage the power of data and AI to transform your organization and create new opportunities.
For more Microsoft Fabric topics 👉 Microsoft Fabric | element61
Why do you need Real-Time analytics
Data has become an essential element in business operations. Every decision or activity leaves a trail of valuable information that can add value to the business when harnessed effectively. Identifying situations and taking action right when needed can benefit a business tremendously.
Fast access to event data is essential for timely action. For example, preventing or responding to disruptions in the supply chain requires real-time monitoring of inventory, transportation circumstances, delivery tracking, or impacts on scheduling. Monitoring can also drive the optimization of supply chain processes to handle unfavorable events. A second example is monitoring sensor data in manufacturing environments, including industrial sensors (e.g., temperature, pressure, energy), optimizing production line performance, product efficiency or quality, and even environmental monitoring, such as chemical sampling of wastewater effluent.
In a traditional data warehouse ('DWH'), data is extracted, processed, and loaded (generally) several times a day. Most of the data follows the same subsequent processing steps with no 'shortcuts' being taken. Time-triggered data warehouse loads increase loading times, resulting in longer latency between refreshes. A DWH solution covers most common reporting needs where a refresh latency of several hours or more is not an issue. But, responding to real-time events with low latency in a matter of seconds is not possible. It requires a more specialized infrastructural approach, such as a Lambda architecture, which provides a faster flow route for the real-time data.

A lambda architecture consists of three layers: a batch processing layer, a speed processing layer, and a serving layer. The batch layer is similar to a DWH setup, while the speed layer provides a parallel path with minimal latency. The speed layer fills in the batch layer's latency gaps that run at a slower schedule. The serving layer responds to queries for batch and speed layers, enabling the business to differentiate between real-time and non-realtime use cases.
Microsoft utilizes the Lambda architecture within Fabric. The speed layer in Microsoft Fabric consists of the recently created Event Stream Service. This service facilitates streaming data from Azure Event Hub to various sinks, including the KQL Database, optimized for real-time applications, Lakehouse (Delta Tables), or Data Warehouse (SQL Tables) for storing event data. The batch layer includes similar ETL (or ELT) solutions in modern data platforms. These solutions include pipelines, dataflows (such as Azure Data Factory), or Notebooks (such as Databricks) for processing data in batches. The results of these solutions can be viewed in Lakehouse (Delta Tables), Data Warehouse (SQL Tables), or Power BI Datamart. Depending on the data store, the serving layer connects to different data stores and enables queries using T-SQL, Spark, Scala, or KQL. It also allows for querying across all data stores except for Data Marts. Lastly, it supports connectivity with Power BI across the board.
Real-time Analytics and Data Activator services use the Fabric Lambda architecture. But what are these services exactly? Real-time Analytics is a part of the Fabric data platform that deals with all the components related to real-time processing. On the other hand, Data Activator is a collection of components that triggers actions and business logic based on conditions met by streaming and non-streaming data. Real-time Analytics is a no-code experience, providing complex alerting capabilities out of the box!
The combination and compatibility of these Fabric components allow business users to ingest data in any data format quickly, run analytical ad-hoc queries on the raw data without conditional transformations, process and alert on data in a matter of seconds, scale up in terms of storage or volume, and integrate their streaming data within the data platform.
Getting started with Real-Time Analytics
It only takes a few steps to leverage Real-Time Analytics for real-time data processing and visualization. This experience greatly enhances the efficiency of the set-up in comparison with modern data platform solutions. Do you want to set up reporting and alerting based on real-time data super fast? Don't look any further.
What are the options to ingest data
Currently, Fabric supports three primary streaming data sources: the Azure Event Hub, Azure IoT Hub, and a Custom Application. The Azure IoT Hub object tackles real-time streaming from IoT devices, providing a framework for identity, provisioning, and data transfer and two-way communication between Azure and IoT devices. The Azure Event Hub object can tackle all other event-based streaming use cases. Fabric provides a no-code solution to connect to both services swiftly. Note that these services are set up and maintained separately from Fabric in the Microsoft Azure platform.
In addition, a custom application is developed to ingest streaming data from external applications, such as Kafka clients, and requires JavaScript and PowerShell experience to configure the connection. The streaming engine natively supports AMQP, Apache Kafka, and HTTP protocols.
Where is the data stored
Several options are available for routing, transforming, and storing real-time data. One such option is to set up an Event Stream object to route incoming data to a Lakehouse database. The Event Stream object provides a no-code environment for capturing and transforming incoming data before routing it to various sinks such as the Lakehouse object, KQL Database, Reflex object, or Custom App. This makes it an excellent option for most standard reporting use cases, including near real-time and aggregated reporting in Power BI.
The second option is to set up a KQL database object that ingests the real-time data directly from the source. In addition, a KQL query set contains pre-defined queries on a linked KQL database, which can be shared or utilized like a common table while ensuring real-time speeds. The capabilities of KQL are similar to those of the Event Stream and Lakehouse combination. However, this option is particularly interesting for fast ad-hoc querying or reporting. Kusto Query Language (KQL) contains native support for technical time-series analysis. Some examples of native functions are advanced filtering options, regression analysis, seasonality detection, and arithmetic functions. These functions are beneficial in use cases such as anomaly detection and forecasting. Other exciting functions are geospatial aggregations, graph semantics, machine learning plugins, or window functionality.
This article continues with a practical example of connecting the Azure Event Hub to your Fabric workspace and utilizing the Lakehouse as a sink for our streaming data.
Step 1: Set up a Lakehouse and Eventstream object
Do you have an Azure Event Hub set up and running in your Azure environment? Great! 🙌 Let's connect to Fabric to enable real-time reporting.
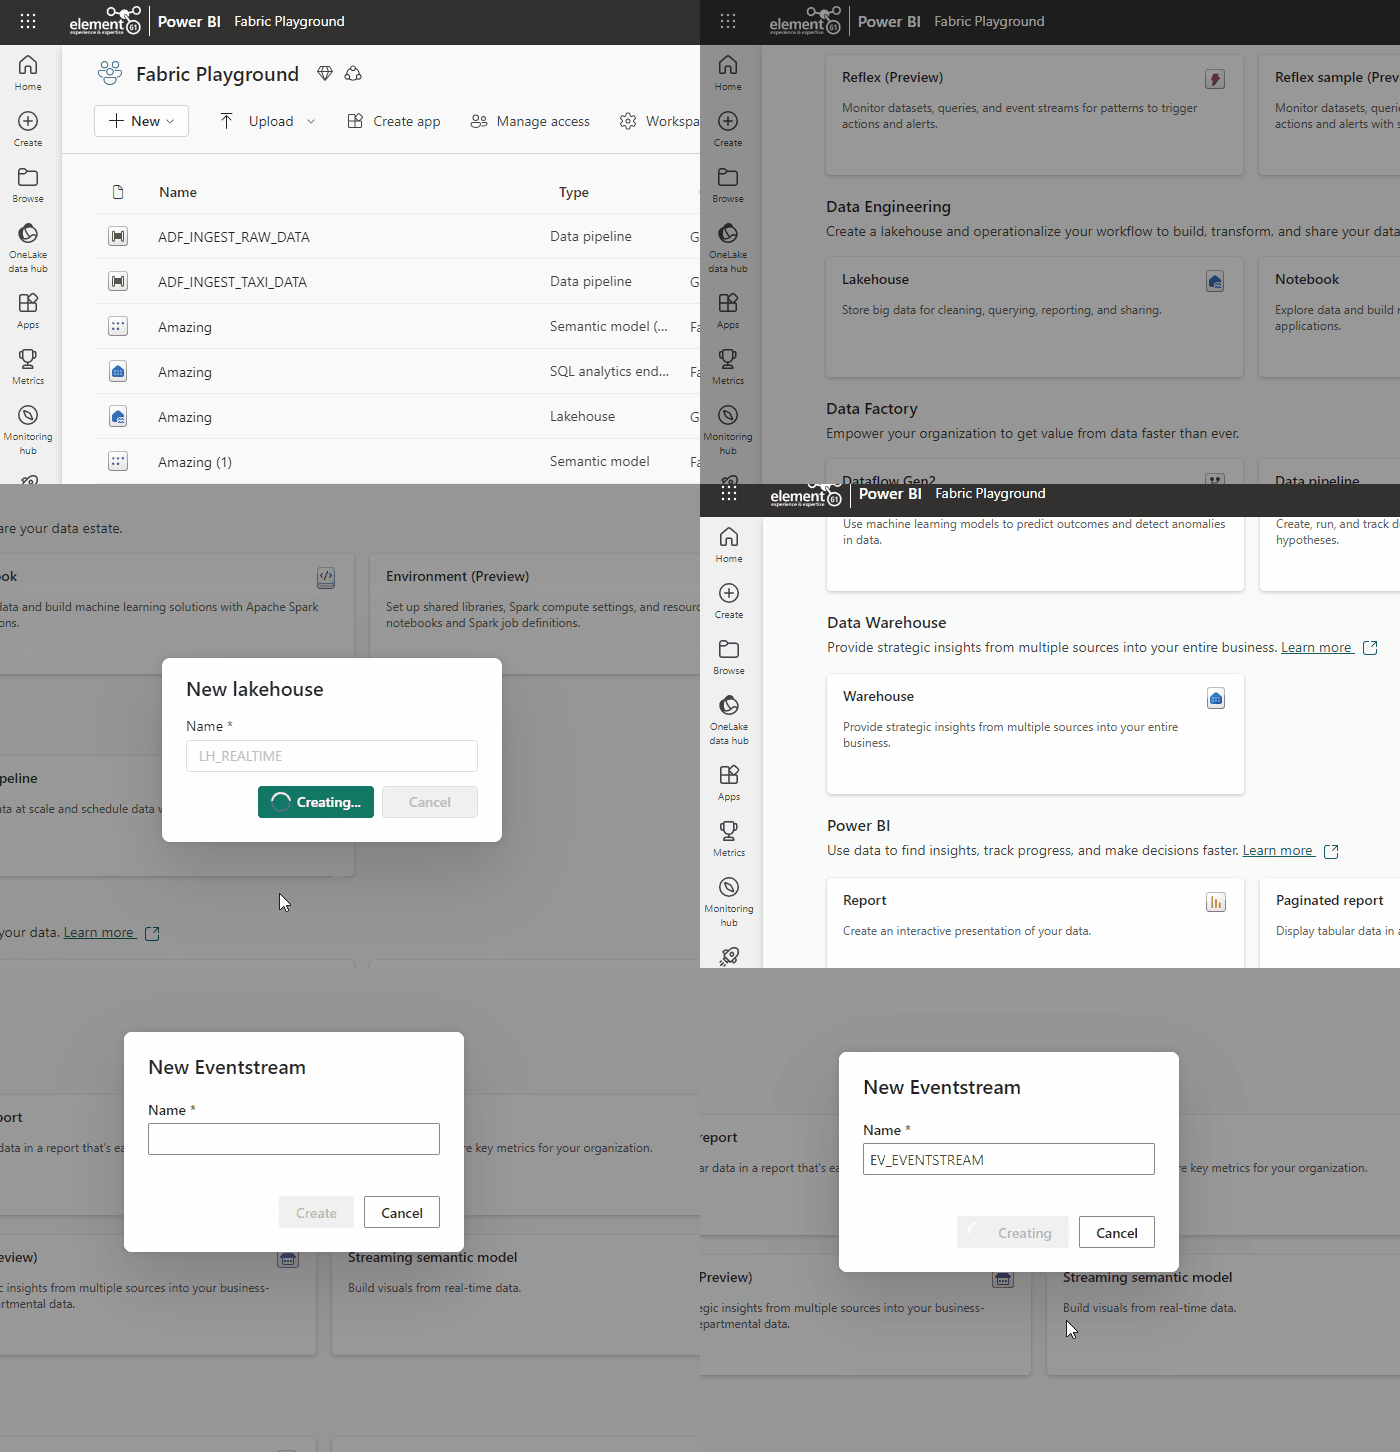
First, we create Lakehouse and Eventstream objects within the Microsoft Fabric workspace. In the Workspace, you will find the (+ New) button; here, we can see both objects currently in preview. Clicking on (Show All) brings us to the Creation Hub page, where both objects can be found. Also, remember to apply naming conventions to identify both objects' intent within the Workspace quickly.
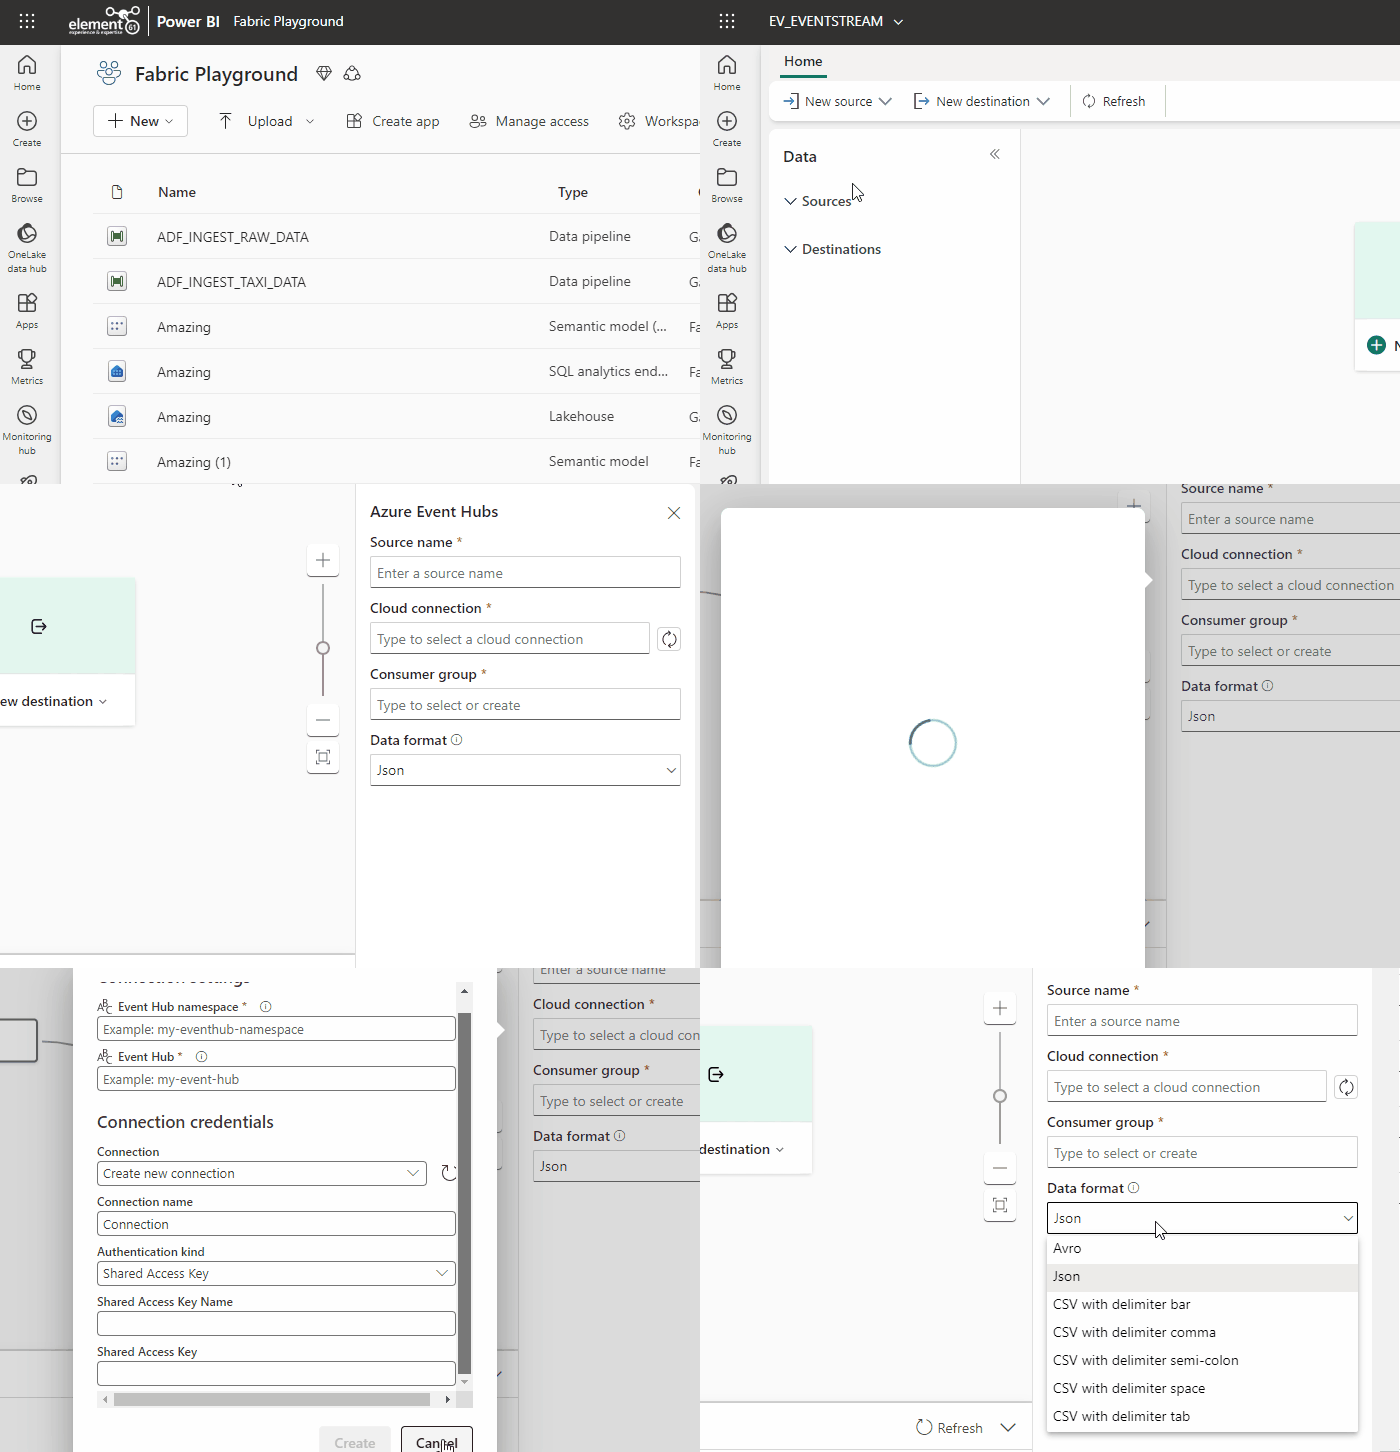
Once created, we connect the Azure Event Hub object to the Eventstream object. Click on the Eventstream object and create a new connection using the Cloud connection field. If you pay close attention, you will notice that this pane resembles the creation pane of a Linked Service in Azure Data Factory. Similarly, connection details, authentication, and privacy settings are configured. Note that a Shared Access Policy on the Azure Event Hub object is required, which involves passing the Primary Key from Microsoft Fabric.
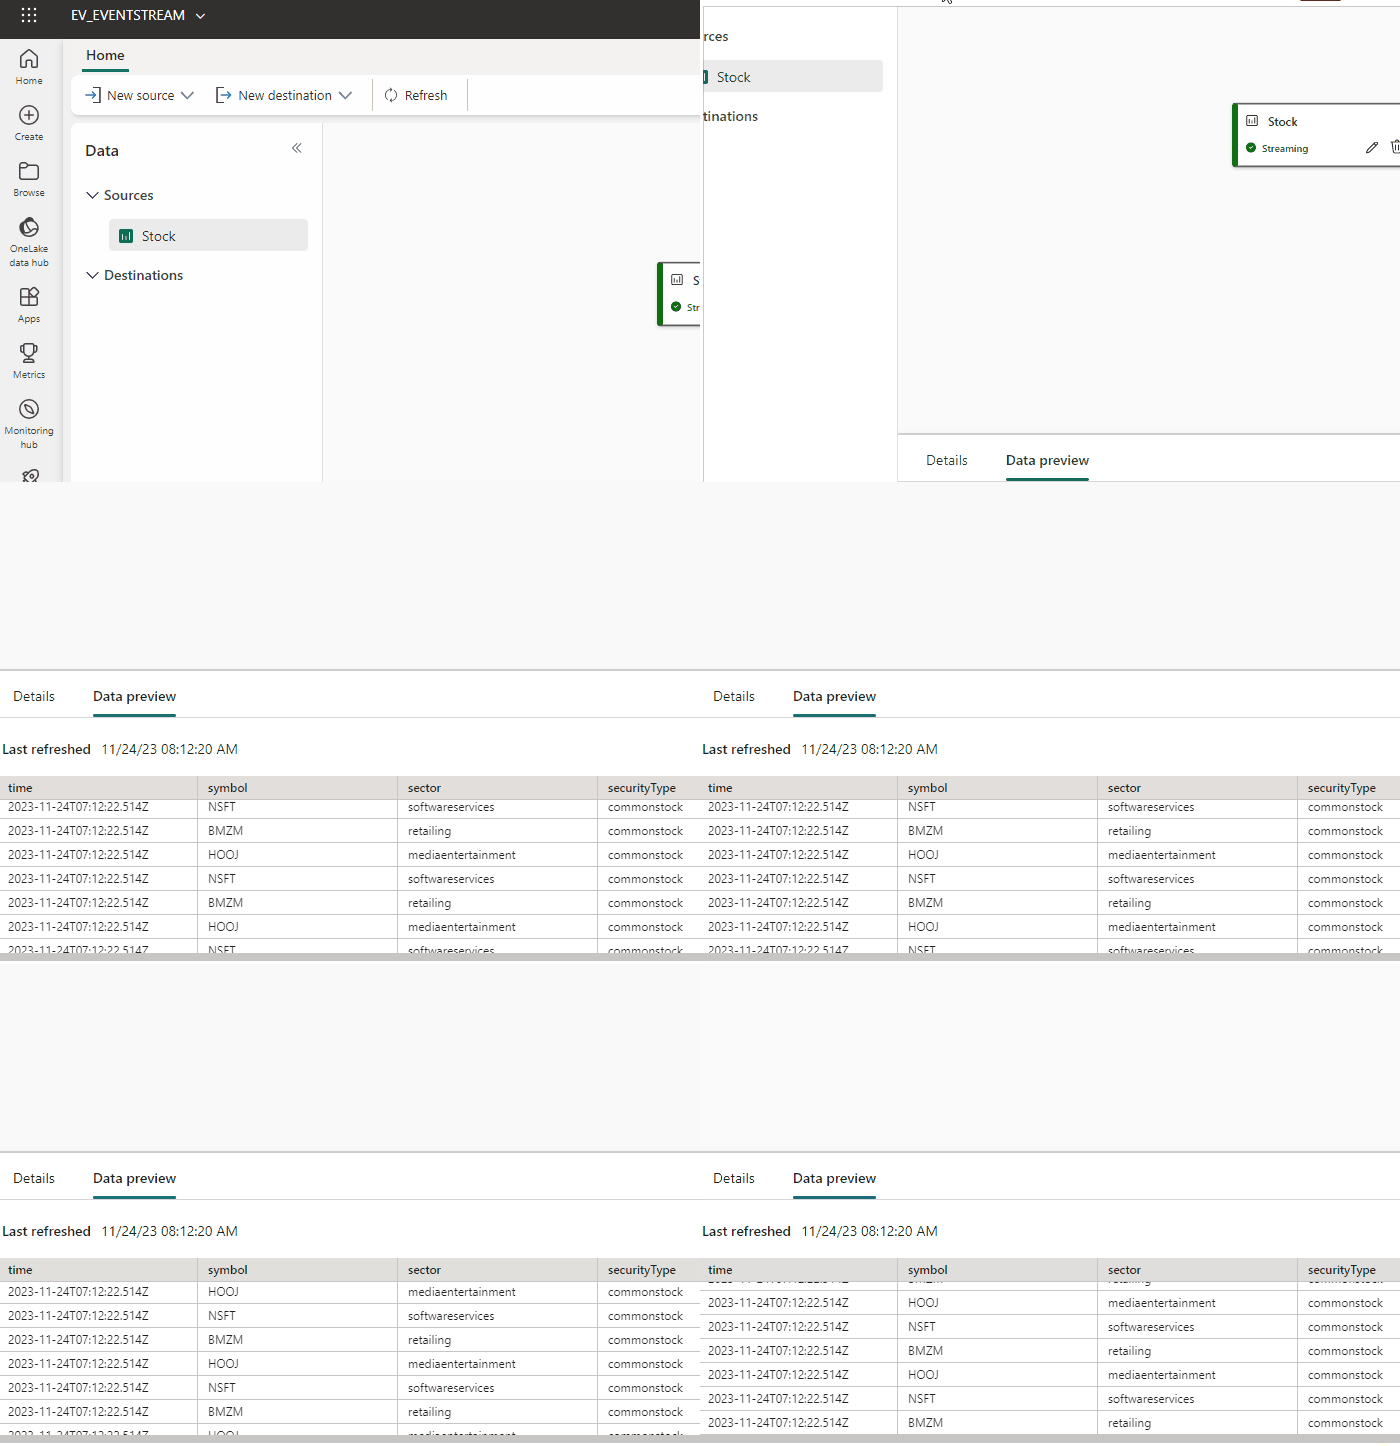
After setting up the connection, we can enjoy a preview of our incoming data by utilizing the bottom-left pane "Data Preview." The incoming data schema is automatically generated, along with refresh details and logs.
Step 2: Add a destination for the streaming data
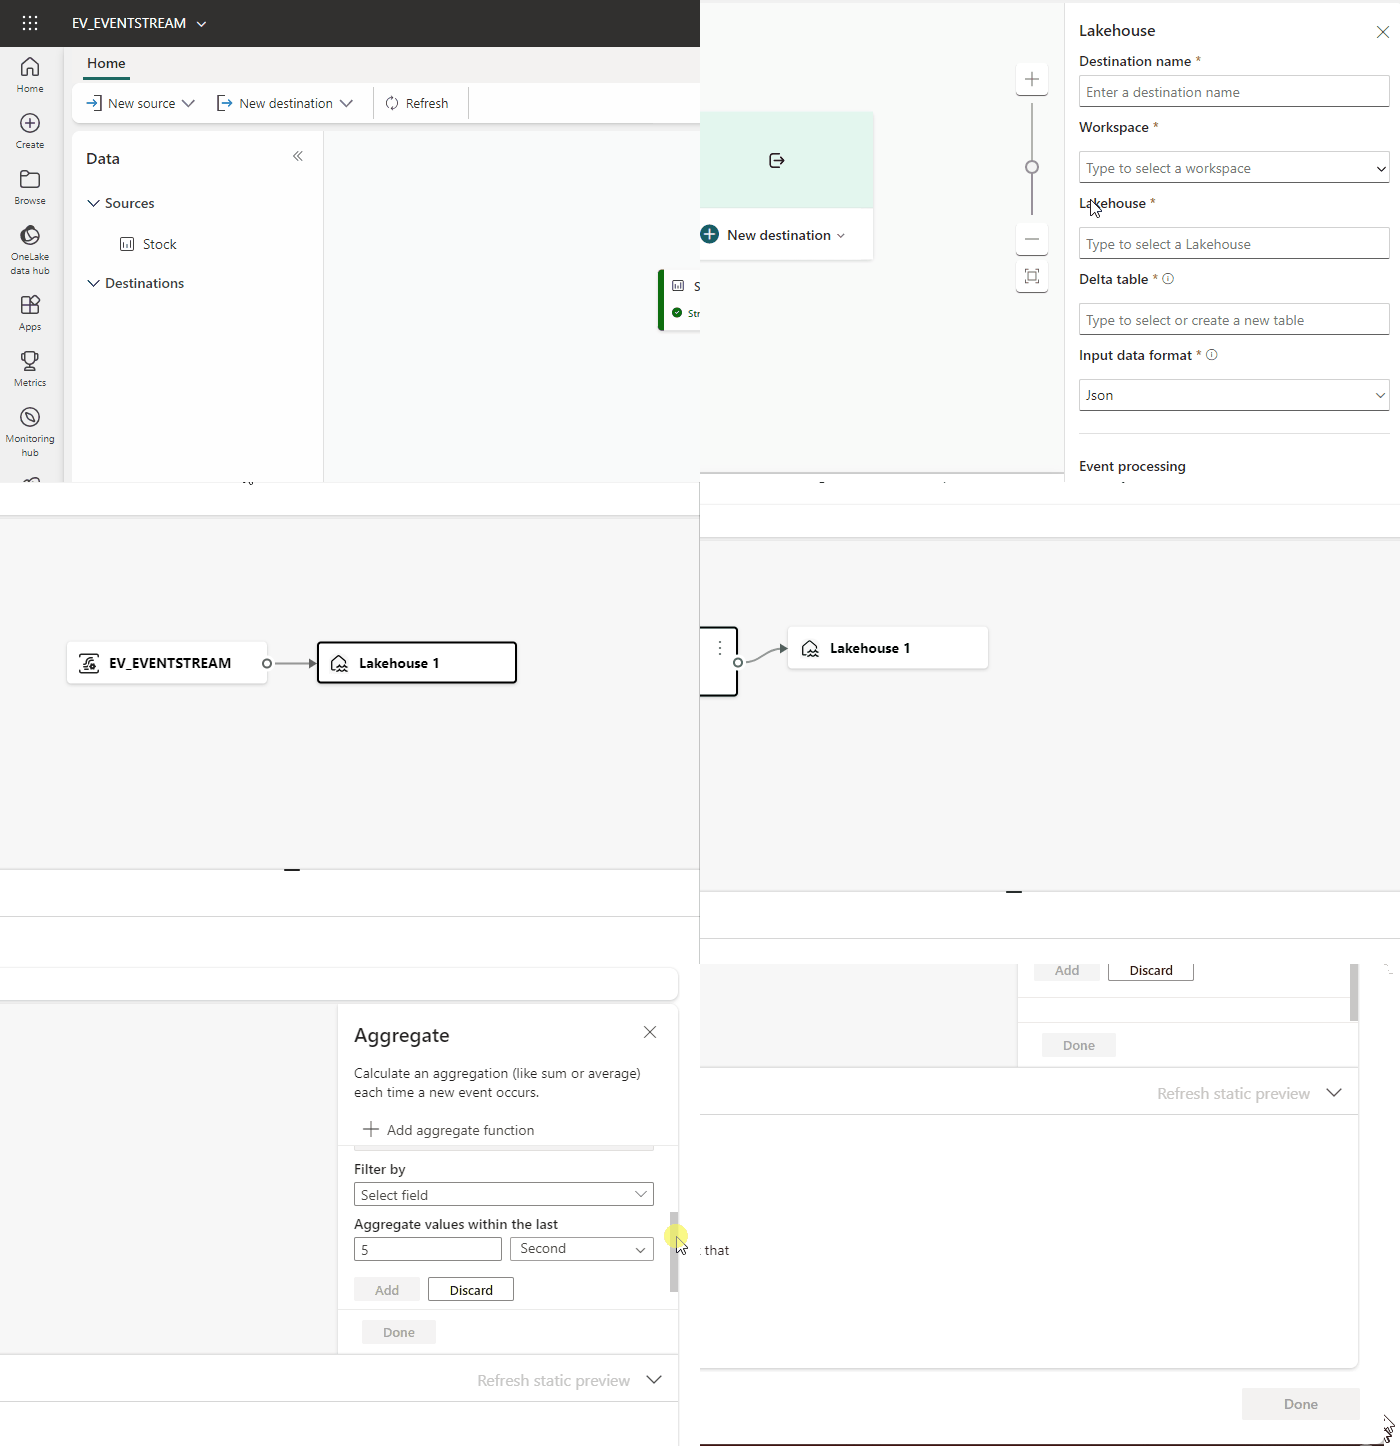
The editor canvas pops up on the right after clicking the Eventstream object. Here, we can add our Lakehouse object as a destination. Note that the interval for writing event data to a Lakehouse object is two minutes.
You might have noticed the 'Open event processor' button. This optional step allows the business to add processing logic to the incoming streaming data. This is a no-code experience where you can perform aggregations, grouping, filtering, expansion, selection or union operations. All processing steps can be dragged and dropped as you would creating a pipeline in Azure Data Factory.
Step 3: Let's report
And voila, we are almost done. It is time to visualize our incoming streaming data. There are several ways Power BI can be set up to report on the newly added streaming data. The first way is to auto-generate a report from within the Lakehouse object. Visuals are automatically generated based on the streaming data that can be identified.
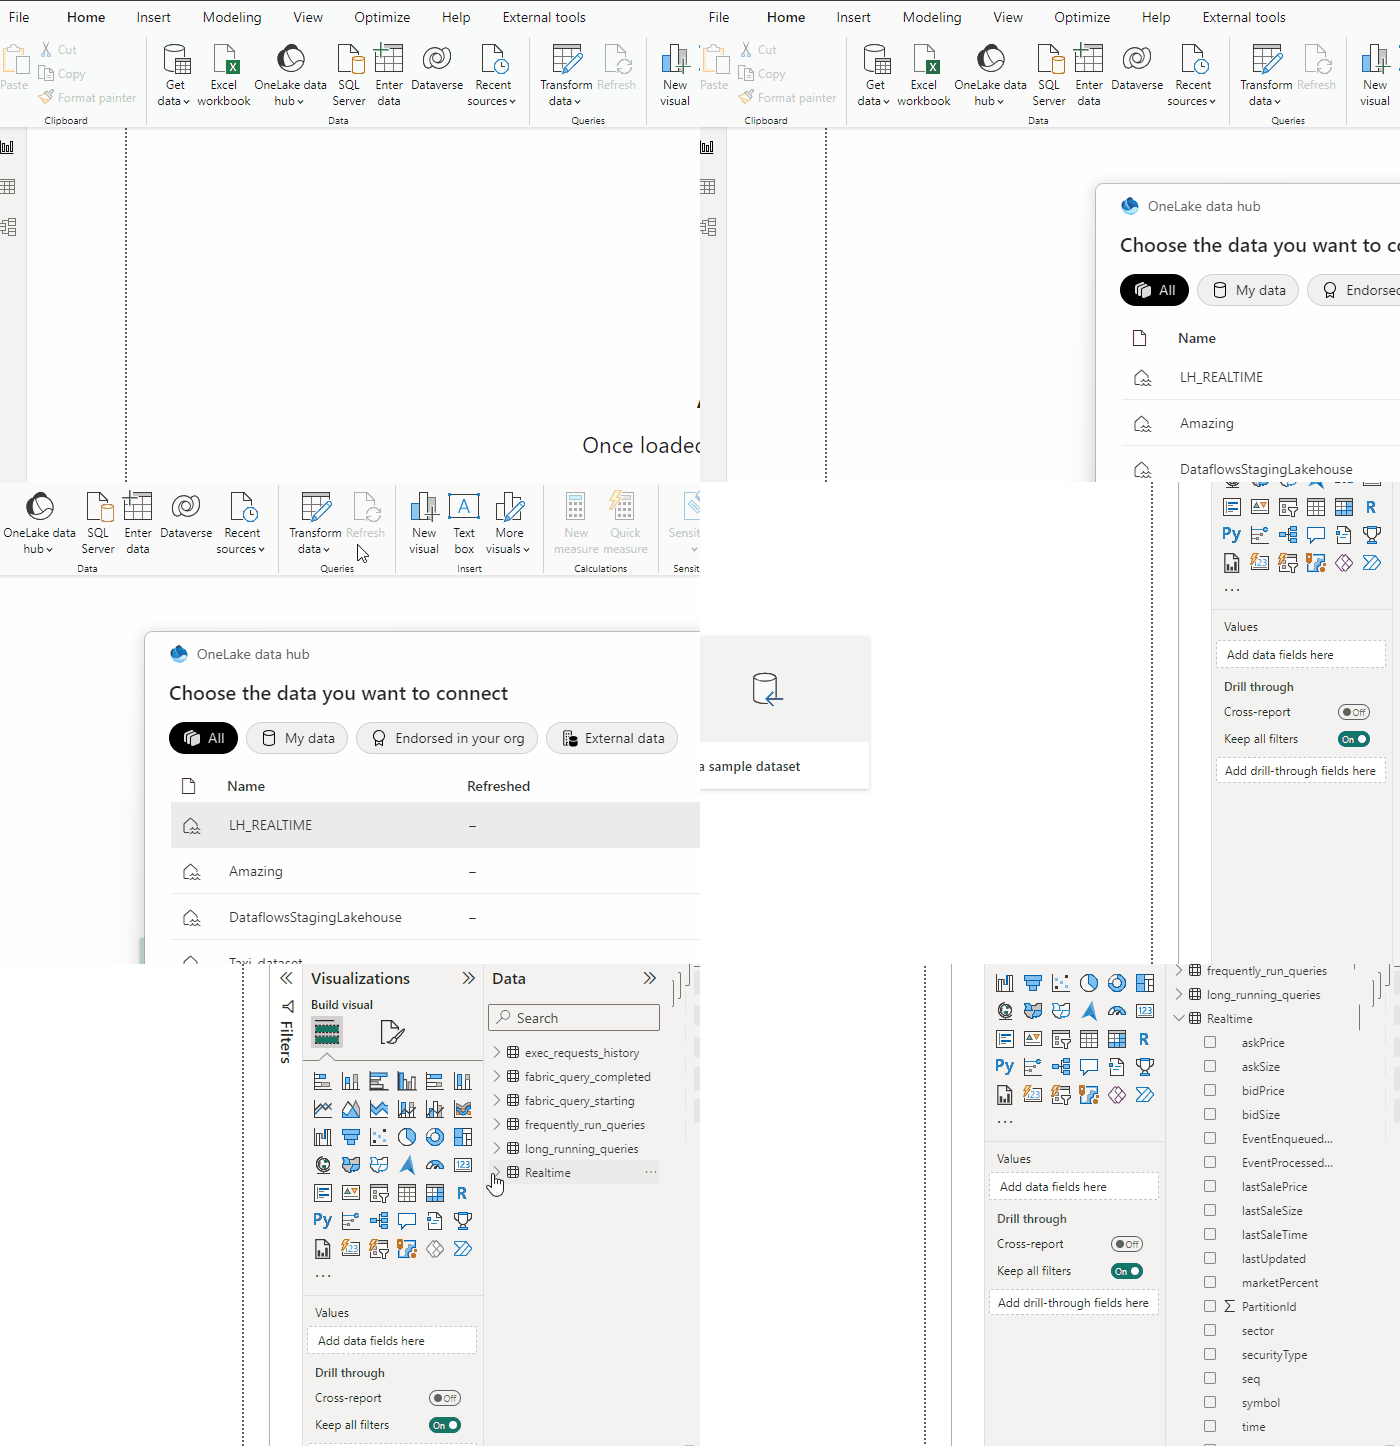
If we create a report from Power BI Desktop, we can connect to the Lakehouse object by utilizing Fabric's new Direct Lake connection capabilities. Unlike DirectQuery, Direct Lake directly loads the data from OneLake without having to query the source data. An alternative solution is to connect to the SQL endpoint of the data source.
Setting up this connection is pretty simple. Select the Onelake Data Hub button from the Homepage and select the Lakehouse connection. Select the dataset that holds the streaming data, and you're set!
Summary
Real-time Analytics is a comprehensive solution for processing data in real time. It simplifies and speeds up the setup of real-time data processing tasks while reducing the need for complex coding or infrastructure setups. Typically, real-time data processing requires extensive architectural, networking, and coding skills from your internal resources. However, now a wider range of users can efficiently set up complex data processing tasks, thereby reducing the necessary development time.
Real-Time Analytics is built on the foundation of Azure Synapse. The primary distinction between the two is that Azure Synapse is a PaaS solution, while Fabric (and Real-Time Analytics or Data Activator) are more deeply integrated SaaS solutions. This difference pertains to the level of control that you have in both environments. Therefore, when considering a migration to a new architecture or starting from scratch, a thoughtful and extensive analysis is necessary, depending on the customer and the long-term requirements.


