Introduction
Everybody who's been working with Power BI has heard (or should have heard) about another great tool, called Dax Studio. If you want a powerful way to look at the measures of a model, look deeper into performance, view the metrics of your model to figure out if there is nothing there slowing you down or eating up valuable space, etc. DAX Studio was and is still the go-to tool.
But for a quick overview of your model's data without creating visuals, explore the DAX Query view in Power BI Desktop. It allows you to efficiently manage measures, design new ones, mass edit your model, and more.
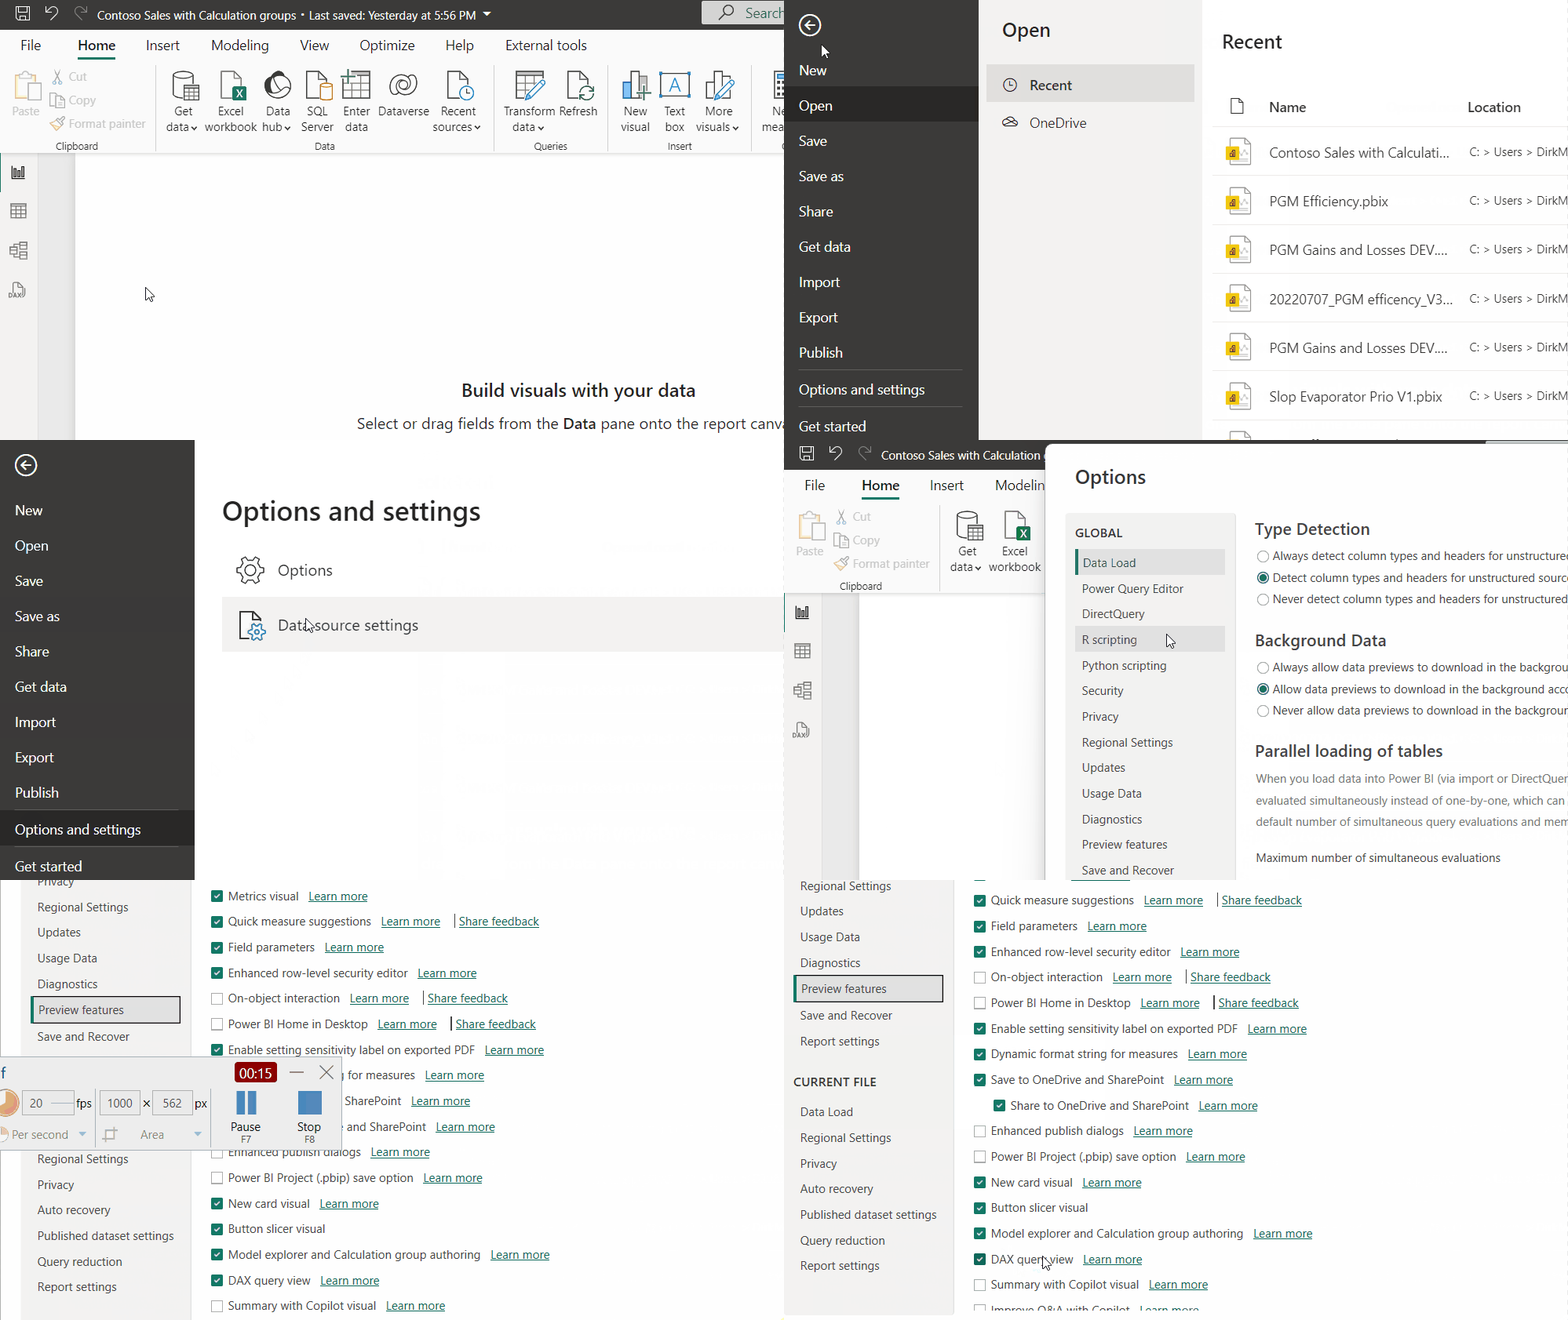
If you don't see the DAX tab on the left of an open report, it means that it's still in preview and you haven't enabled the preview feature.
You can enable it in the settings :

Let's take the grand tour
You've seen how to access it from the views (on the left, 4th one from the top),

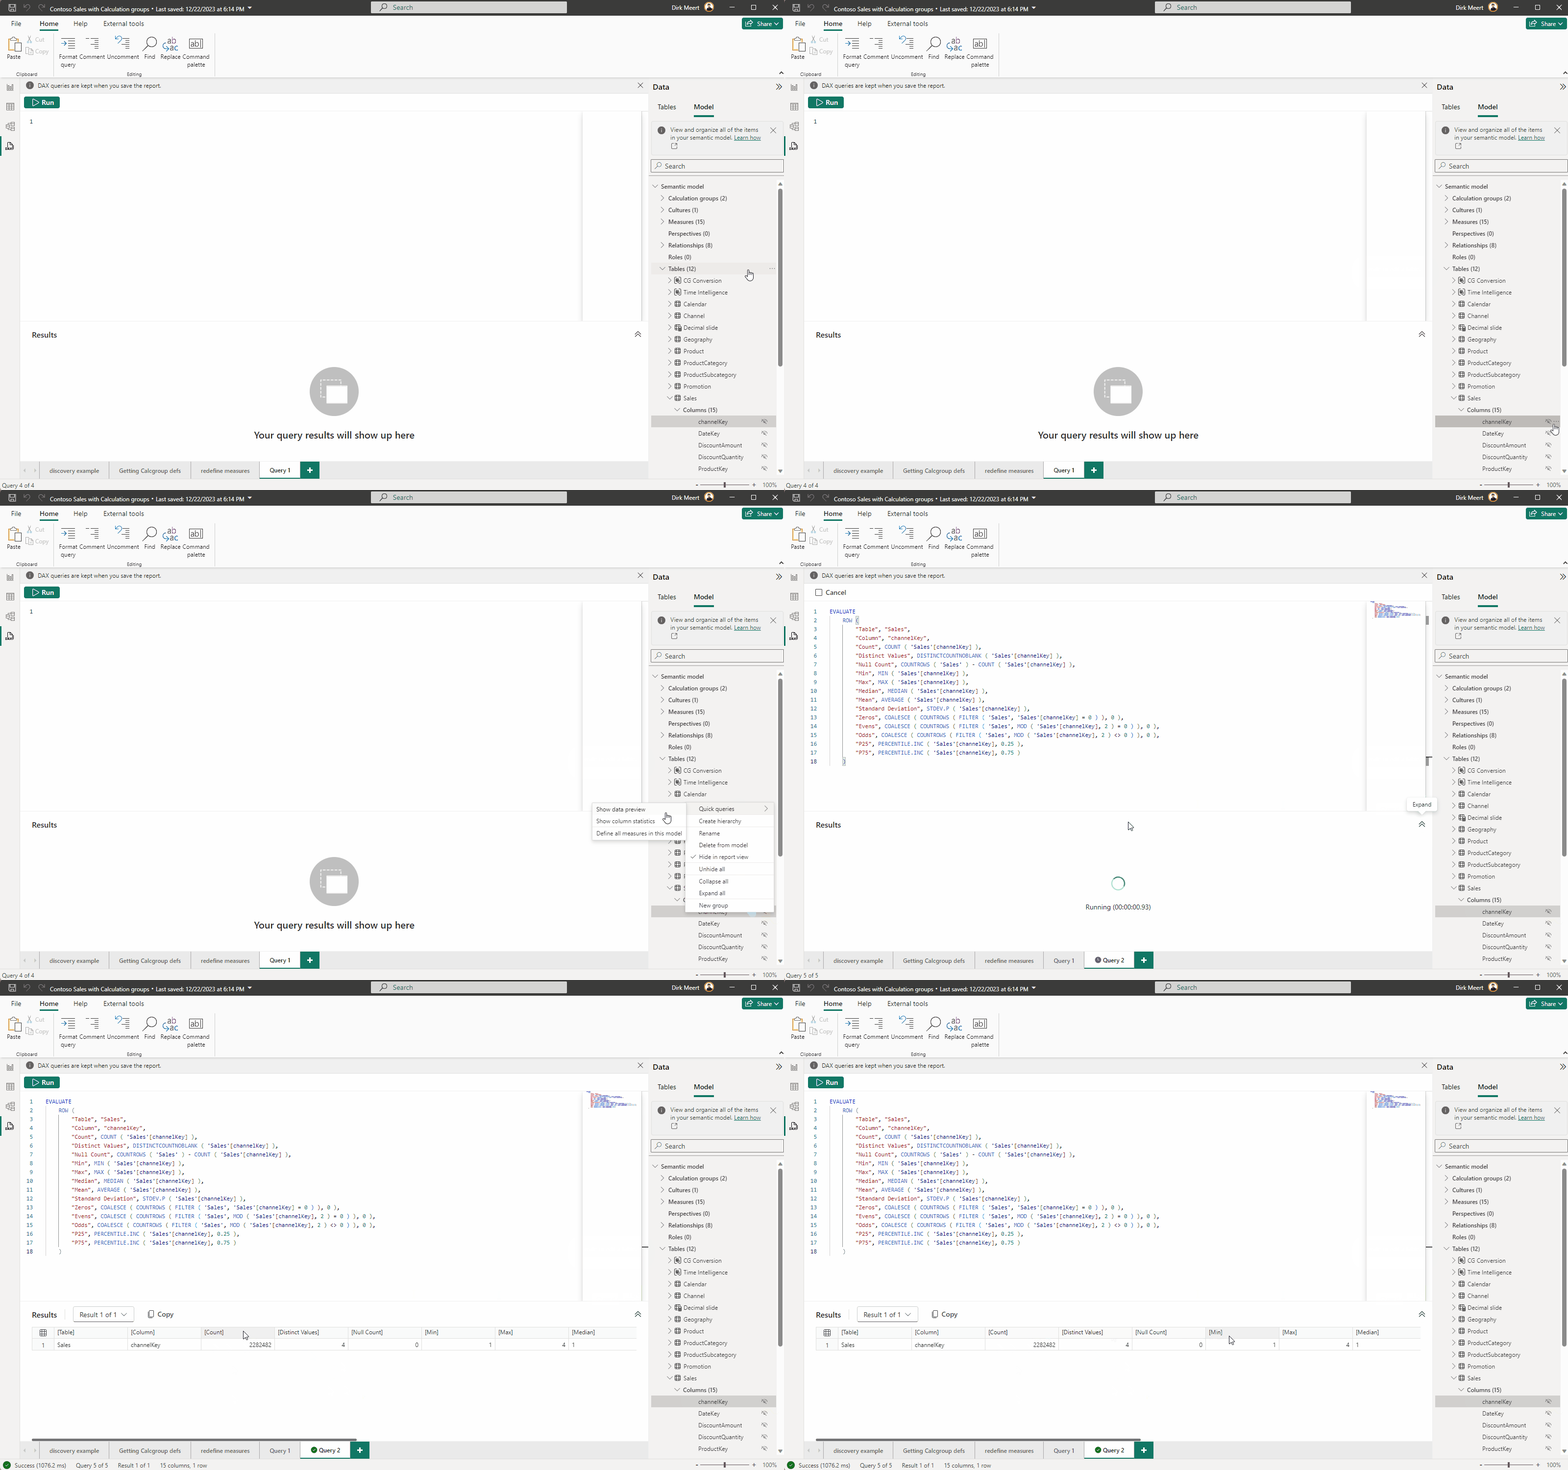
It comes with:
- a customized ribbon for all the shortcut buttons to (un-)comment, format, find-and-replace
- Command bar with the Run button(Shortcut: F5 or CTRL+Shift+E )
- the DAX query editor, where all the DAX code is written by you or created for you via Quick Queries
- the result grid, showing you all the resulting sets from your "evaluate" commands
- a Data Pane with a view of either the tables or the model, with all its aspects, and from where you can also launch Quick Queries.
- You can also have several queries open simultaneously and switch between them in the Query Tabs. All these queries you open are saved when the report is saved
Level 100: I'm new at DAX 😱 (or gotten a bit rusty)
Don't worry, and let the Quick Queries get you going. Just like DAX is written for you in the background while you are creating visuals, in DAX Query view you can have some of the heavy lifting done for you. Just go to the Data Pane and try one of the 8 quick queries available by context, either for tables, fields, measures or for the whole model.

The "Show top 100 rows" will generate the code to do just that, when selected on a table, and you can use that to elaborate on and experiment with.

Find out the definition of a measure and evaluate it
If you use the right-click menu on any measure of the model (via the Data pane) you'll see these 4 options.

The most interesting one here is "Define with references and evaluate"

Here you can see the most elementary form of DAX:
DEFINE allows you to declare one or more measures and variables
EVALUATE runs a piece of DAX which typically delivers a result set. In the example above, it runs the measure without any filter context
In this case, the measure was a simple one with no underlying measures, but in the one below, I asked for the same quick query on a variant, built on top of the first one "Quantity Sold QTD" and it draws in the definition of the base measure as well

When you hover over a keyword, you'll get quick help.

There is also the autocomplete functionality and suggestions for column names while typing.
Tweak 🧵a measure (or a couple)
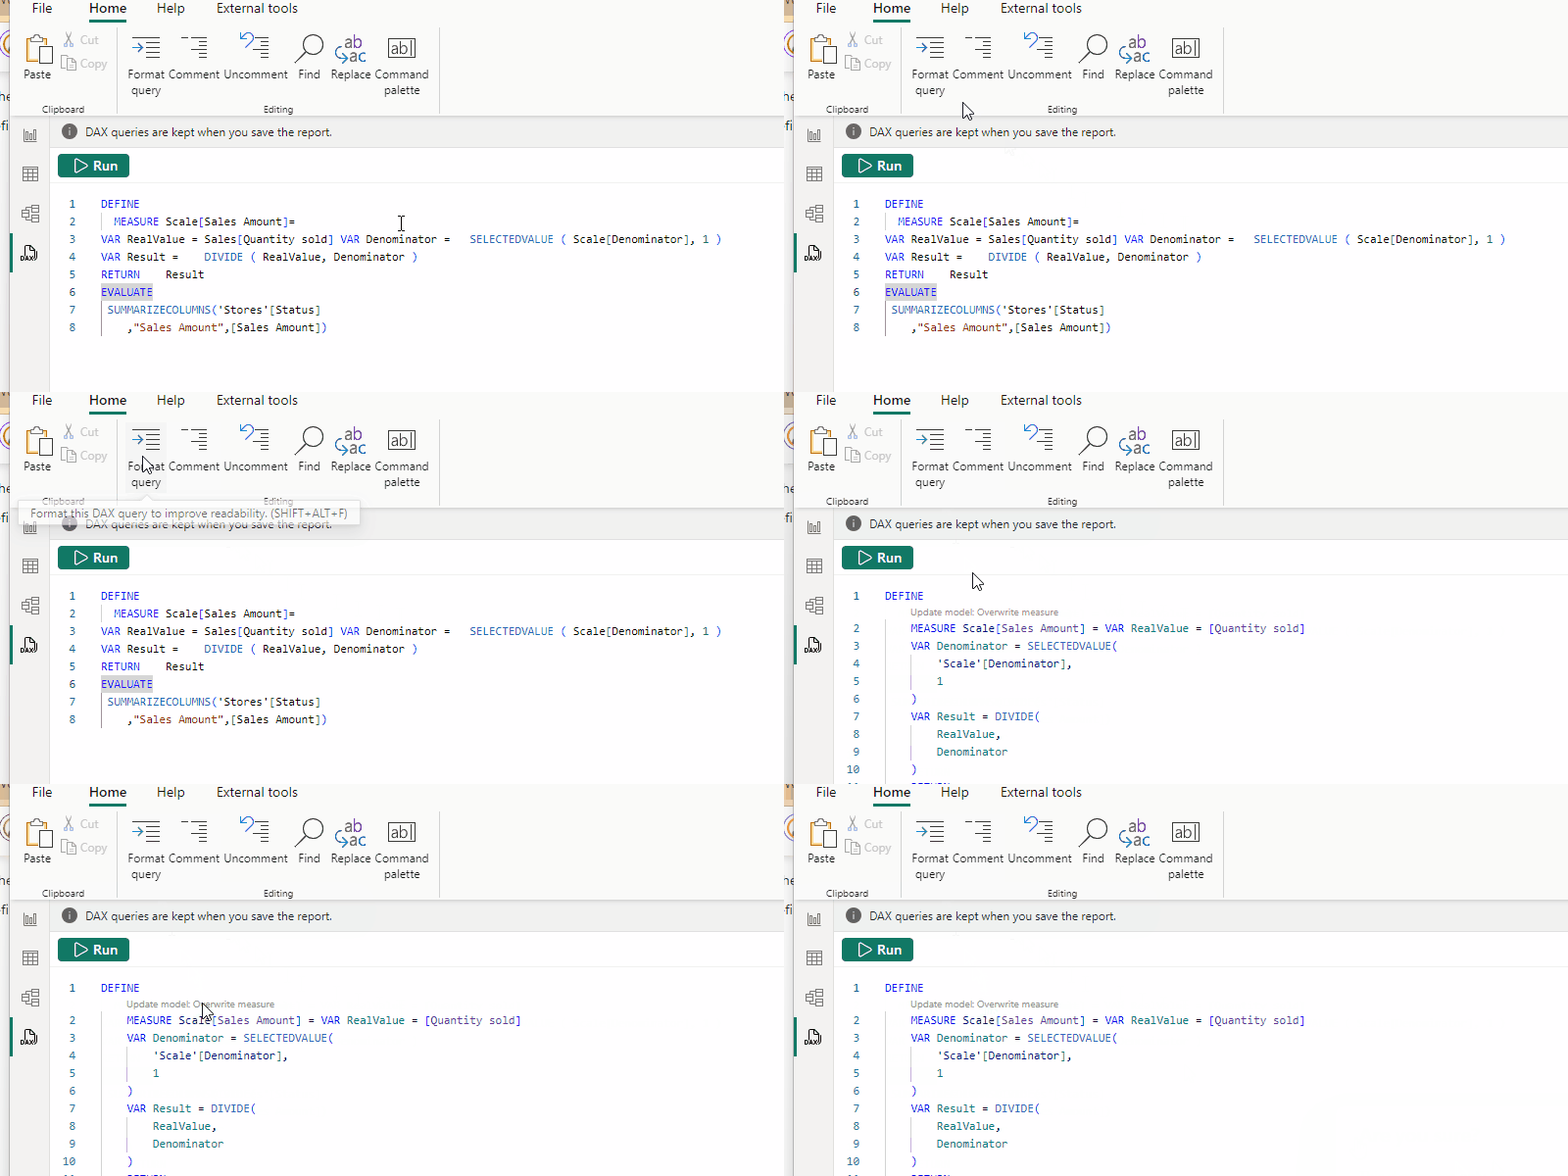
When you make the slightest change on one of the measures in the DEFINE statement, you'll notice a little grey text "Update model: Overwrite measure" pop up. This is called a Code Lens. and it allows you to update measures straight from the DAX Query view if you wish.
If you'd like to play around with the measure above until you get the desired result, you can tweak the code in the current query, and no changes will take place in the model. You will also not need to wait for visuals to update, as you would in the Report view. I guess most of us have gotten impatient at the "working on it" whenever you make one too many clicks when the measure editor is open.
In the DAX query view, you can make as many changes as you like, without waiting. Once you hit the "run" button, you'll need to wait only for the execution of the code, and not for the refresh of all the visuals on the current report page.
No changes to the measure will be made in the model, until...you click "Update model: Overwrite Measure"

Evaluate the data quality 🔎
In Power BI, you normally evaluate the data quality by going to "Edit Query" to retailor your table from its sources. You can judge uniqueness, completeness and diversity. But if you imported data from a source which isn't available because, for example, you've gone offline, you can't check on the column distribution or profile anymore.

Well, you have Quick queries to help you out. Either on a single column or for all columns in a table, the Quick query "Show Column Statistics" gives you the same information. The result set shows a number of NULLs, cardinality, amount for different values, averages... and you can even change the code to assess if other business rules are respected

Level up: another 3 quick wins
How to reuse your measures in other reports 🔄
Yes, the best practice is that you have all your measures in the model. But sometimes life is not fair, and we have a bunch of measures in somebody else's report (or your own 🧐) and you also need to apply the same elsewhere. Or sometimes you'd decide that the measures were purely cosmetic and then turn out reusable.
Before this feature, you'd have to go over all the measures and apply them one at a time in the other report.
But now, in the DAX query view, you can use the quick query "Define all measures" from any item in the model

You'll get a script with all the definitions. Just copy the measures you need and save them in any text format you wish, or paste them straight into the DAX query view in another report and click on the Code lens
What if ..."Colleagues complain that they can't read my code"📜
...and I don't feel like I have the time to go through the whole report.
Just like when you make a change in a bit of code, the Code-lens allows you to make changes permanently, well the same applies when you use the format button 👍
All you need is to use the quick query "Define all measures", available on any level (table, column or measure).
Click on the Format button in the ribbon,
go over all the Codelens buttons (there could be quite a few.. but that depends on how well the formatting was respected before 😁)
and presto 🪄 complaints evaporate and order is restored.
And as the editor has a "Find and Replace" like any other good text editor you can mass edit any ambiguous naming to match conventions.
The only snag (so far) is that you'll need to click on the code lens through the whole set of changed items

How to speed up your visuals... or at least discover what slows them down.
Power BI already gave you insights into which visual takes what part of the rendering time of your page. It also allowed you to copy the DAX query so you could analyse it in, for example, DAX Studio. But now you can simply run it in the DAX Query view, so you can instantly tweak everything involved and spot what measure or filter is the factor which slows down your report.

The resulting query not only shows the measures and headers of the matrix but also shows the filters. allowing you to comment out part of the code to see if results come faster.
Do realize that data caching may give false impressions when rerunning the queries. This is better in DAX Studio which has settings to clear caches.
Level 300: Kickstart your report, and auto-document
You have a base kit and want to get it in 📊
When you have a set of best practices, like standard measures, or simply want to implement a common DAX pattern like
https://www.daxpatterns.com/parameter-table/
in your report, you don't need to code it all manually, one by one.
Instead, simply open the DAX query view, copy the code from your standard set in an empty query and then hit the "add measure" code lens for every added measure. (Truth be said, it would be handy if they added a "apply all changes" button)
Note: the code from the pattern above, requires you to also define a table. This can't be done in the DAX Query view but can be easily achieved in the Table view, using the sample code.
OMG, they asked if my documentation is up-to-date 😬
From December 2023 onwards, things got even better for us. Just like in most other systems, the metadata has now become available to you, using the INFO tables. Now, while this doesn't give you the full functionality which a tool like MS Purview would give you, it does allow you to get some of the definitions out of the model into a result set that you can copy to Excel and further use.
While the measures can be easily gotten out with quick queries (as described above), the INFO schema allows you, like a DMV in an SQL server, to get out some other lists.
An example below is how to get out calculation groups with their items and format strings:
EVALUATE
    VAR _items= SELECTCOLUMNS(
        NATURALLEFTOUTERJOIN(
INFO.CALCULATIONITEMS(),
     SELECTCOLUMNS( INFO.FORMATSTRINGDEFINITIONS(),"Format",[Expression],"FormatStringDefinitionID",[ID])
        )
,"Item",[Name],"Ordinal",[Ordinal],"Expression",[Expression],"Format",[Format],[CalculationGroupID] )
    VAR _groups=SELECTCOLUMNS(
        NATURALLEFTOUTERJOIN(
        ADDCOLUMNS(INFO.CALCULATIONGROUPS(),"CalculationGroupID",[ID])
        ,SELECTCOLUMNS(INFO.TABLES(),"TableID", [ID],"Calculation Group",[Name]) )
           ,"Calculation Group",[Calculation Group],"Precedence",[Precedence],[CalculationGroupID])
    RETURN  SELECTCOLUMNS(
        NATURALLEFTOUTERJOIN(_items, _groups),[Calculation Group],[Precedence],[Item],[Ordinal],[Expression],[Format])
        ORDER BY [Calculation Group],[Ordinal]

You can find more examples in the article
https://powerbi.microsoft.com/en-us/blog/dax-query-view-introduces-new-info-dax-functions/
Conclusion:
DAX Query view is a major power tool added to Power BI.
It allows you to quickly view data, and inspect its quality without creating visuals.
While not replacing DAX Studio, it offers quite some advantages like a place to tune your DAX measures, code formatting, and adding new measures on the fly, after testing them out. Offering also the possibility to kick start your report by allowing you to add in all your standard code in one go.


