Introduction – Setting up the scene
I recently came across an interesting request from one of our customers where we are doing a cloud implementation of their complete operational business.
The datawarehouse is meant to contain data for Sales but also Purchasing, Production & Inventory.
Each domain is closely related to each other and often share the same common dimensions & sometimes even fact tables.
The end goal is then to display various reports in different Power BI reports & workspaces.
The interesting part is that the IT department wants to logically split each business from each other while still allowing super users to have this “360” view of all the data if needed.
This means that we need to provide a Sales dataset for the Sales Department, a Purchasing dataset for the Purchasing Department and so on, while also providing a complete Operational dataset for those power users.
It’s important to note that the intention was not to secure the datasets from each other, but rather to allow each department to access a smaller subset of data, without having to scroll through facts, dimensions & measures not related to their own business.
For example, as a salesperson, I would only see measures & tables related to “Sales” when connected to the Sales dataset, effectively making my life easier when I create reports or access the data through “Analyze in Excel”.
While looking at the request, I was trying to find out the easiest way to answer the need while avoiding data duplication & maintaining one version of the truth across the whole project.
One thing was certain, I didn’t want to create 4 or 5 different datasets reusing the same tables & publishing them to different workspaces.
I’m not a fan of Object Level Security, due to it’s report-breaking nature when you are not authorized to see the data which is not a suitable solution.
The solution – Direct Query for Analysis Services
In December 2021, Microsoft released Direct Query For Analysis Services in preview.
This feature allows you to connect to an existing dataset and increment on top of it: You now have the capability of adding new columns, sources, or even other datasets to your current Power BI dataset (or Tabular model, if you are working on analysis services).
Previously, if you were connected “live” to a Power BI dataset, you didn’t have much room to play around.
This is a great feature for self-service BI, which seems to be the focus of Microsoft (We’re looking at your datamart).
Now, in our case, we are not really doing any self-servicing, but we are still using the feature to help us in this scenario: Instead of duplicating the data across multiple datasets, we can now create one central dataset & logically link smaller datasets directly to this central dataset.
The idea is to create one global dataset containing all measures, facts & dimensions for all domains.
Once published, we can now “Direct Query” on top of this Power BI dataset & remove all unnecessary tables & measures to accommodate the requirements of a specific domain.
Once done with the finetuning, we can simply publish this sub-dataset to a new workspace.
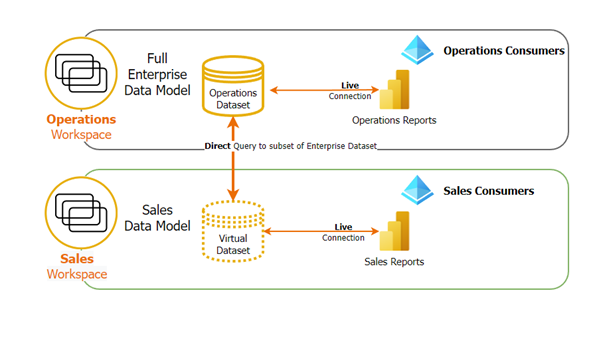
To keep things simple, the schema only highlights the implementation for the Sales domain, it is identical for all others.
The implementation & result
Our global dataset – Operations - contains all measures & facts:
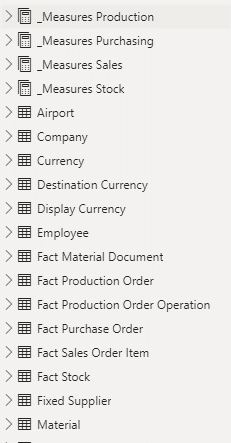
We have decided to split the measures into different custom tables because it is currently not possible to hide measures or folders. With this approach, we can then hide all measures not related to Sales by not importing the other custom tables in the Sales dataset.
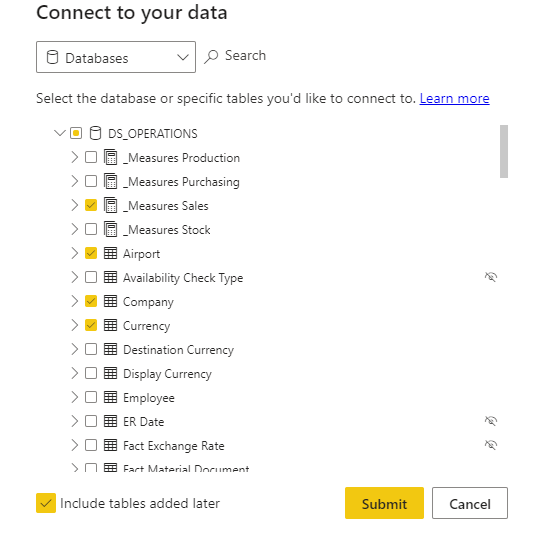
The Sales dataset can direct query on this dataset & nitpick the needed tables & measures:
This has the advantage of maintaining only one version of the truth – The Operations dataset - and answers the need of splitting the user base across different workspaces & reports.
If IT decides to add a new table, column, or measure in the Operations dataset, it will automatically synchronize across all relevant datasets, simplifying the maintenance across all domains immensely.
If you want to avoid adding extra tables automatically to your sub-dataset, you can simply uncheck the “Include tables added later” box.
A salesperson can now access the “Sales Workspace” & see their own “Sales dataset” relevant to him.
A power user who requires the need to do cross-domain reports will then connect to the operations dataset.
Performance
At the moment of writing this insight, the feature is still in preview.
I’ve occasionally encountered some broken visuals, which usually get resolved by refreshing the dataset.
In terms of pure performance, you will suffer a hit on your DAX statements due to the direct query component, but it is most of the time negligible if you are using relatively simple visuals & reports.
It can become noticeable if you consume & create heavy reports with complex row context calculations (think the SumX function on massive tables or reports with 25-30+ visuals for example).
Metadata changes
To my surprise, any metadata change will not automatically be pushed toward the lower-level dataset.
If you, for example, add a new measure in your Operations dataset, you’ll have to download your sales dataset, refresh it, and republish it to the sales workspace to be in sync and see this new measure appear in your report.
This can become cumbersome if you iterate a lot on your model and have to keep all your child datasets in sync.
Final thoughts & conclusion
As explained in the introduction, this approach is not meant to secure datasets: For the dataset to be accessible, the user needs to have read & build access to the original dataset. We are not effectively preventing access to the original workspace & dataset.
In conclusion, while we are diverting a bit from the initial intent of the feature, this allows a great deal of flexibility with workspace & dataset management.


