Introduction
For a while Power BI provides access to Business Intelligence developers using REST API endpoints. These endpoints can be used to do administrative things; like creating workspaces, assigning users to specific datasets, … . We can use the same endpoints to retrieve data from Power BI. This data can contain information from e.g. reports, dashboards but also transactional data in the format of events e.g. page refreshes, opening reports, … . In our understanding, this could be a potential source for actionable insights in terms of Power BI governance and BI team performance metrics.
In this insight, we are going to focus on Power BI governance insights regarding workspaces. The result is some Power BI reports containing these insights.
Architecture
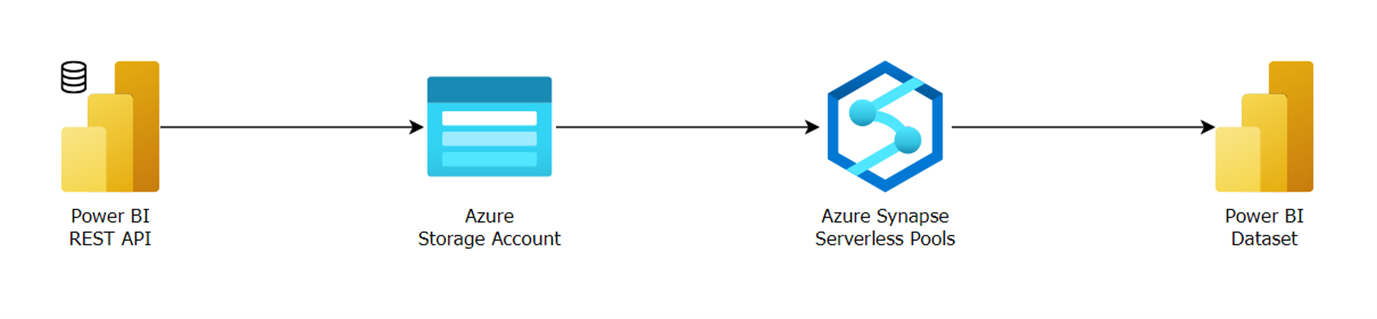
The image below contains our architecture that will support our solution. Our orchestrator are Azure Synapse data pipelines. These pipelines will transport the data between the different resources presented in the image. At the left, we have the Power BI REST API endpoint. In this example, we are accessing the workspace entity. With some instructions, we will get out workspace information in a JSON format. This is a semi-structured data format containing information in key-value pairs. It’s semi-structured because of the fact that the data is not in a straight table format. These JSONs will be stored in a Storage Account hosted in Azure. Directly on top of this Storage Account/Data Lake we are going to process and transform our JSON’s using the Serverless Pools of Synapse. Serverless pools is a distributed data processing system where we can easily execute SQL queries on data coming from a data lake. It is an excellent tool to do some ad-hoc querying on large amounts of data. If it needs to be more stabilized we can easily migrate these scripts to a Data Warehouse for example. In the Serverless Pools we built a small star schema containing the workspace information. At last, we are going to push back this information to a Power BI dataset of our choice to present it to the end user. In the Power BI dataset we install our DAX measures containing our valuable business KPIs.
Power BI REST API
As it is stated in the online documentation, you can manage Power BI content, perform admin operations and embed Power BI Content using the REST API. Like all other API’s the output is in a JSON format.
With a simple GET request you are able to get information out of the workspace endpoint. For example a list of all current workspaces. In every workspace there is a link to the reports, datasets and users that are being part of this workspace. We can set up a link between these different entities.
An example of a JSON that is returned by the endpoint can be found in the code below.
{
    "@odata.context": http://wabi-north-europe-redirect.analysis.windows.net/v1.0/myorg/admin/$metadata#groups,
    "@odata.count": 283,
    "value": [
        {
            "id": "f707135b-082a-4df7-9daa-a8cc7e8f43ef",
            "isReadOnly": false,
            "isOnDedicatedCapacity": false,
            "capacityMigrationStatus": "",
            "description": "ksd demo for embedding",
            "type": "Workspace",
            "state": "Active",
            "hasWorkspaceLevelSettings ": false,
            "name": "Embed demo ksd",
            "users": [
                {
                    "emailAddress": arne.hoefkens@element61.be,
                    "groupUserAccessRight": "Admin",
                    "displayName": "Arne Hoefkens",
                    "identifier": arne.hoefkens@element61.be,
                    "principalType": "User"
                },
                {
                    "emailAddress": karel.moijson@element61.be,
                    "groupUserAccessRight": "Admin",
                    "displayName": "Karel Moijson",
                    "identifier": karel.moijson@element61.be,
                    "principalType": "User"
                }
            ],
            "reports": [
                {
                    "id": "1441B9D6-6079-4399-BCBB-2EFE10214BFC",
                    "reportType": "PowerBIReport",
                    "name": "test sla",
                    "datasetId": "5a1deea3-5d44-4aa5-8361-57fc34d0b65e",
                    "users": [],
                    "subscriptions": []
                },
                {
                    "id": "CA99D02C-9183-4671-9898-F08F134C3248",
                    "reportType": "PowerBIReport",
                    "name": "Service Desk Report",
                    "datasetId": "5a1deea3-5d44-4aa5-8361-57fc34d0b65e",
                    "users": [],
                    "subscriptions": []
                },
                {
                    "id": "0E38A11F-63F6-457C-9C46-8C6662831270",
                    "reportType": "PowerBIReport",
                    "name": "IT Spend Analysis Sample",
                    "datasetId": "06e412ce-78c4-4344-bb6b-2782ad2648f7",
                    "users": [],
                    "subscriptions": []
                }
            ],
            "datasets": [
                {
                    "id": "5a1deea3-5d44-4aa5-8361-57fc34d0b65e",
                    "name": "test sla",
                    "addRowsAPIEnabled": false,
                    "configuredBy": arne.hoefkens@element61.be,
                    "isRefreshable": true,
                    "isEffectiveIdentityRequired": false,
                    "isEffectiveIdentityRolesRequired": false,
                    "targetStorageMode": "Abf",
                    "createdDate": "2019-02-06T10:13:12.707Z",
                    "contentProviderType": "PbixInImportMode",
                    "upstreamDatasets": [],
                    "users": [],
                    "isInPlaceSharingEnabled": false
                },
                {
                    "id": "06e412ce-78c4-4344-bb6b-2782ad2648f7",
                    "name": "IT Spend Analysis Sample",
                    "addRowsAPIEnabled": false,
                    "configuredBy": arne.hoefkens@element61.be,
                    "isRefreshable": true,
                    "isEffectiveIdentityRequired": false,
                    "isEffectiveIdentityRolesRequired": false,
                    "targetStorageMode": "Abf",
                    "createdDate": "2019-02-21T18:29:04.27Z",
                    "contentProviderType": "Unknown",
                    "upstreamDatasets": [],
                    "users": [],
                    "isInPlaceSharingEnabled": false
                }
            ]
        }
Power BI Reports
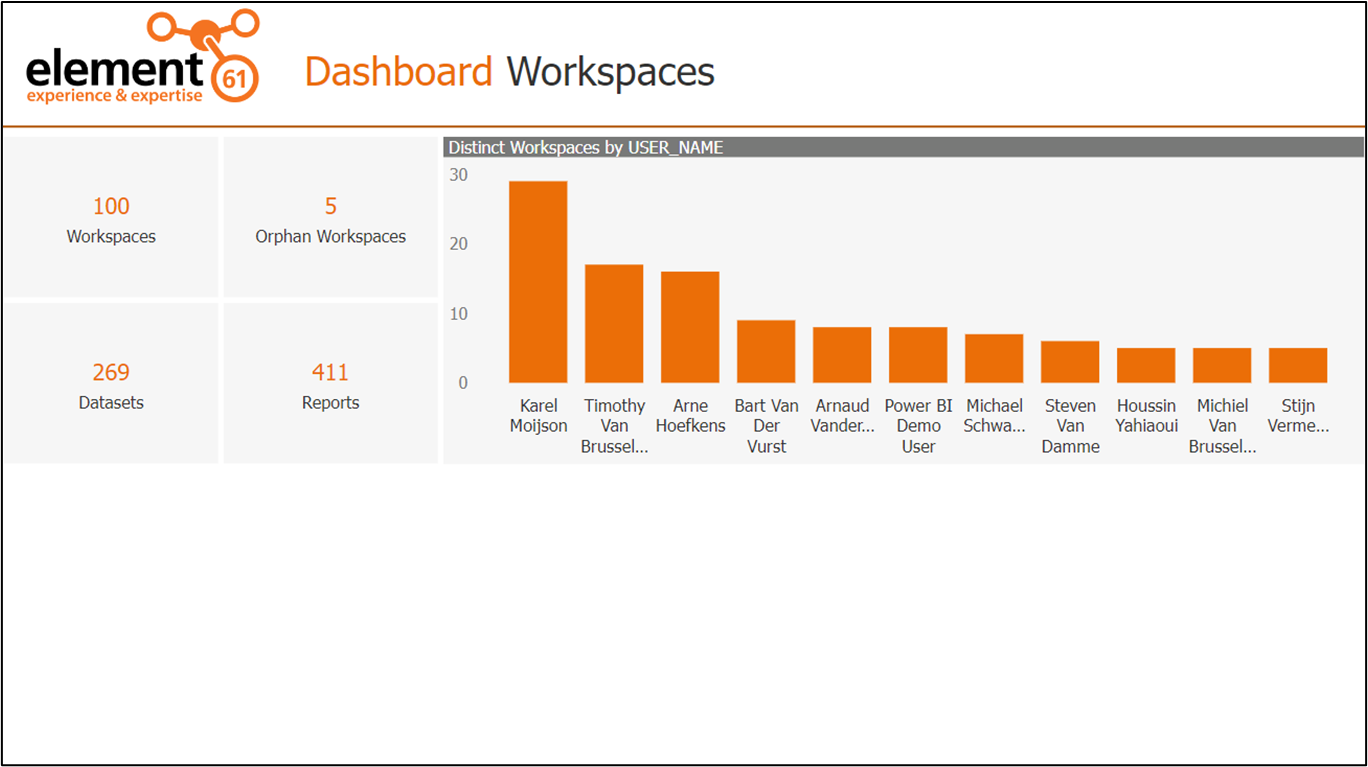
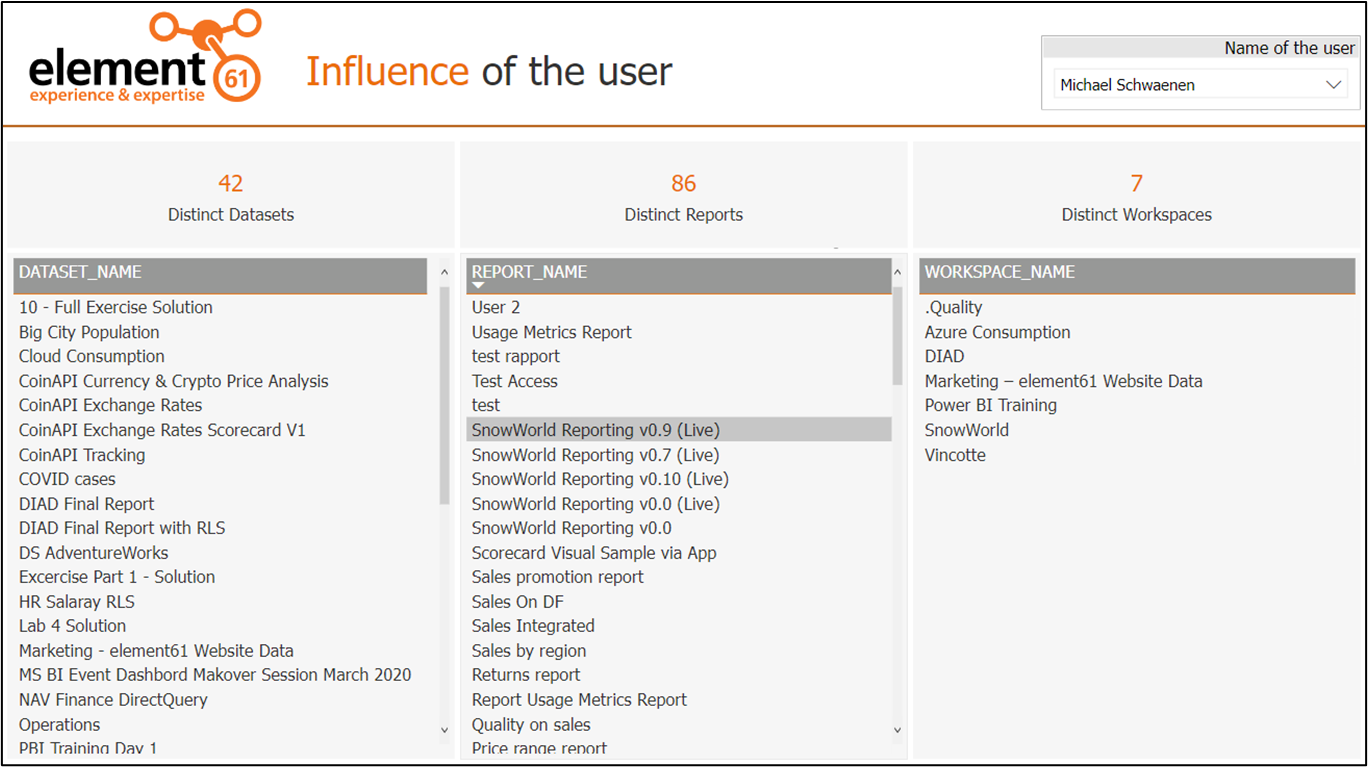
In the end everything comes together in a nice Power BI report 🥸 The proof of the pudding is in the eating. Below you can find some images with some workspace statistics. For example your top performers in your organization. Or how many workspaces don’t have any users inside of them? Or what user has access to which reports? The possibilities are endless. This report is only containing some data without events. If you want to see how much people accessed a certain report or a workspace then you can add the events on top of this report.
Conclusion
There are a lot of possibilities for using the Power BI REST API. And it is possible to include it in your modern data platform.


