Introduction
The Matrix is a 1999 American science fiction-action film starring Keanu Reeves, Laurence Fishburne and Carrie-Anne Moss.
The film depicts a future in which reality as perceived by humans is actually a simulated reality created by machines. A computer programmer ‘Neo' is drawn into a rebellion against these machines. The film is best known for popularizing the use of a visual effect known as ‘bullet time', which allows the viewer to explore a moment progressing in slow-motion as the camera appears to orbit around the scene at normal speed, providing context to the scene from all possible angles.
The method used for creating these effects involved a technique in which a large number of cameras are placed around an object and triggered nearly simultaneously. Each camera is a still-picture camera, and not a motion picture camera, and contributes just one frame to the video sequence. When the sequence of shots is viewed as in a movie, the viewer sees what are in effect two-dimensional ‘slices' of a three-dimensional moment.
The information matrix
Originally the term ‘bus matrix' was invented by Ralph Kimball. Here an analogy was made with a system bus in a computer. Each dimension can be seen as a single connector on a bus or lane. The combination of all dimensions provides thus a full contextual overview for a certain business process. As such the relationship between facts and dimensions can be clearly visualized in a very compact way.
Today the 'bus matrix' has evolved into an information matrix, which depending on the objectives can be adapted to cater for certain specific needs. The examples in this document are for illustration purposes only and do not have the intention to be entirely correct, nor complete.
Why?
In any Business Intelligence project, the data model (i.e.a collection of integrated star schemas) can be considered as the most essential component. On the one hand, it is the result of a prioritized list of business requirements, while on the other hand it is essential input to the ETL design & development, interface file specifications, the reporting semantic layer, the individual reports and cube definitions, justto name but a few.
Mostly the data model is created using specific data modeling tools such as PowerDesigner or ERwin. These tools enable definition, modeling functionalities, meta data capture & reporting functionality and data definition language generation (read: SQL-scripts). Next to the data model - which can become very large due to its nature in terms of detailing the data model down to attribute or column level, including all metadata properties on that level - there is room for a more conceptual presentation of that same data model.
This is where the information matrix comes in. These matrices, which can be easily constructed in standard tools such as Microsoft Excel, prove to be in the first place visual aids which establish an easy medium for communication between the different parties involved in any Business Intelligence project. It offers a compact high-level overview of the heart of the Data Warehouse and can be used to quickly train new Business Intelligence team members on the content of the Business Intelligence system, likewise it can quickly provide an overview of the information content possibilities to the end-users. Furthermore it can be used as input to define a future roadmap determining which information domain can or needs to be tackled first. Finally it can be used to perform a high-level impact analysis.
The matrix typology
Department matrix
This matrix is a perfect primer to show which business process' information is in demand by which department. The more departments are in need of the information related to a particular business process, the more likely that the overall involvement will be much higher. As such the perfect candidate to start with your data warehouse effort is identified.
-
Top axis: all relevant departments
-
Left-hand axis: all relevant business processes
In the underneath example, it would make more sense to start with the invoice revenue business process, given the need for information about this business process by 3 different departments. Off course in practice also other factors play their roles in this selection process; complexity, source availability, business urgency, business case, budget, sponsor…

Business process matrix
This matrix gives an overview of the combination of all relevant dimensions with all business processes within a certain high-level subject area. A check mark in a cross-section points to a relevant relationship.
It is important to use business processes here instead of departments in order to avoid the risk of duplicate data, the duplication of ETL development work, the increase of upload time, the risk of different labelling and different terminology.
-
Top axis: all relevant dimensions
-
Left-hand axis: all relevant business processes
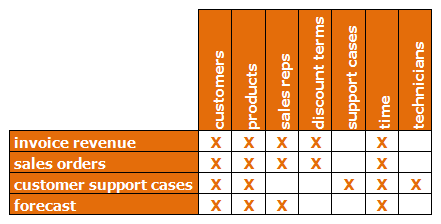
When reports are using information from 2 or more facts, the common dimensions will be used as glue to tie the data from both facts together as one.
Information matrix
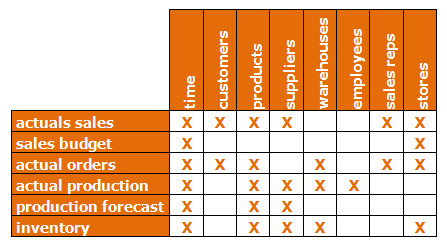
This matrix gives an overview of the combination of all relevant dimensions with all facts within one single business process. The cross-sections indicate the granularity or level of detail. A check mark in a cross-section points to a relevant relationship. Typically this matrix will start of as a high-level conceptual overview, detailed further on towards its final conception.
When the dimension levels will be detailed further, a checkmark might be replaced by a certain dimension level which might be more applicable than the most atomic detail of that particular dimension in relation to a certain fact, or will remain a checkmark indicating the lowest level as defined within the dimension. This matrix can be easily extended for all business processes instead of just one single business process.
-
Top axis: all relevant dimensions
-
Left-hand axis: all relevant fact (tables)
Source matrix
This matrix (starting from the business process or information matrix for that matter) can also be used by replacing the checkmarks by a color code pinpointing to priorities, availability, source complexity or cost and as such revealing other interesting viewpoints.
-
Top axis: all relevant dimensions
-
Left-hand axis: all relevant fact (tables)
In the matrix hereunder an example is given on the component of issues and source complexity.
-
Cross-sections
-
Green: no issues / low source complexity
-
Yellow: minor to medium issues / complexity
-
Red: high issues / complexity
-
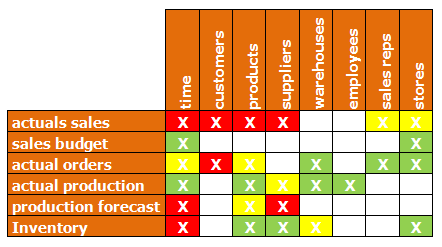
As such this matrix can be used to see which issues need to tackled first before a certain fact can be sourced completely and / or correctly. In the above example the fact ‘actual production' shows little or no issues / complexity, whereas the fact ‘actual sales' shows a high complexity towards integrating multiple dimensions.
This matrix can also be used to scope fact by fact.
Best practices
The information matrix can be extended with
-
All individual measures which are located in the fact tables
-
All or most important source(-table)s for a certain fact
-
Technical and functional names of the dimensions and facts
-
Business processes grouping different facts
-
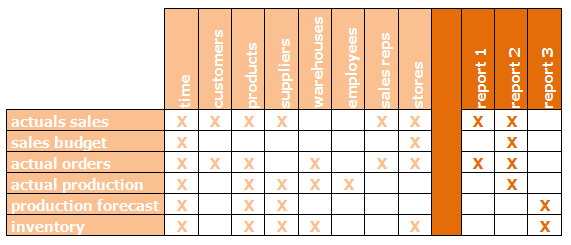
Reports in which the facts are being used – for obvious reasons only for the most important standard reports. Even in a requirements analysis phase in order to visualize and understand the dependency between the facts' importance and the corresponding reports. This understanding can be an important aid in the project management planning process in correctly planning the different related ETL and front-end efforts.
-
Top axis: all relevant dimensions / reports
-
Left-hand axis: all relevant fact (tables)
-
-
Positioning
-
The time dimension should always be positioned first
-
Common dimensions should be always be positioned secondly
-
Stand-alone dimensions should be located as last
-
Try to group the dimensions logically together?eg. customer & sales rep should be located in each other neighborhood
-
Facts belonging to the same business process should be positioned near each other
-
-
Possibly use color coding to group dimensions or facts
-
An ‘X' always refers to the most granular level of a dimension as defined
-
When a higher level of a certain dimension is used versus a certain fact, it should be indicated as such in the corresponding cell
-
An ‘X' for the dimension cells may be replaced with the ‘D' for date level. When other levels, such as Monthly, Quarterly or other level are needed they should also be referenced adequately as such
-
When multiple roles of a dimension or at stake versus a certain fact, they should all be indicated in the cross-section?Eg: time dimension could refer to order date and reference date for the same fact
-
When executing a high-level impact analysis (1) for a change which impacts the grain of a certain dimension, one can easily, thanks to the definition of common dimensions, identify all related facts which will be impacted as well
-
When executing a series of high-level impact analysis (2), the information matrix could be slightly adapted to fit the needs.
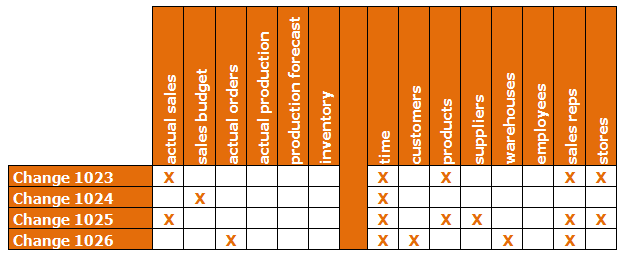
An overview per change can be established in terms of its impact on either facts or dimensions. Using this technique it is possible to group different changes together, based on their combined impact on the same dimensions or facts. This will also support the planning process of the different changes.-
Top axis: all relevant facts / dimensions
-
Left-hand axis: all relevant changes (potentially leading to BI projects)
-
-
In the example underneath it is clear that change 1024 & 1025 have an impact on nearly all the same dimensions, potentially these changes should be grouped together in order to gain time in the forthcoming ETL processes and in order to avoid rework or even loss of work.
-
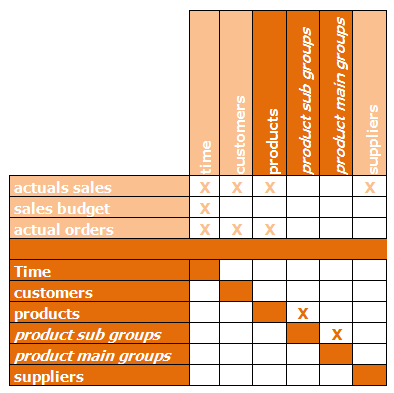
In order to visualize the different levels of an hierarchy within one dimension, the following technique could be used:
-
Top axis: all relevant dimensions
-
Left-hand axis: all relevant facts / all relevant dimensions
-
In this example product rolls up to product sub groups and product sub groups rolls up product main groups. Product sub groups and product main groups are in italic, meaning that they are not the lowest level in a particular dimension.
-
Finally consistency is a factor to pay attention to, across all the different matrices and across different projects.
Conclusion
In a typical Business Intelligence effort a data model is central and as such crucial. Specific data modeling tools can be used to model the different star schemas. Next to this it is vital that a high-level dense overview exists which can be used for optimal communication and understanding.
Upfront a strategy should be defined on how to model what using which tools & techniques. Once this decision is taken, all different components should be kept in sync, taking into account development pressure and working with team members with less knowledge of the tools and techniques. Finally all information should be made electronically available, serving both technical and functional usage.
Soon in a theater near you :-) !