It is a solid buzzword: predictive maintenance is here to revolutionize operations & maintenance – but how? In this insight – a summary of thesis research project between KU Leuven and element61 – we summarize a theoretical dissection of the concept, clarify some recommendations & tips and evaluate a hands-on predictive maintenance Proof of Concept done at a Belgian manufacturer.
1. What is Predictive Maintenance?

Maintenance relates to a large portion of an organization's cost, this becomes even more defined in a highly connected, rapid, high-tech environment where unscheduled downtime can have serious repercussions and damaged parts are not that easily replaced. So, a proper maintenance strategy that minimizes these unscheduled downtimes and increases the efficiency of both the machine’s performance and maintenance is necessary.
There are 2 main strategies for the maintenance problem. Firstly, we have corrective maintenance, the oldest and still most adopted strategy. Here a machine failure will happen and a maintenance crew must come in and fix the problem. However, this strategy in most cases is a losing one, as unexpected disturbances to the process, whatever the size, can in the best case annoy the operators and in the worst case lead to a catastrophic failure of the whole system. Due to these inefficiencies, many organizations have started scheduling and planning maintenance before machine failure occurs. This preventive approach has many strategies and has become even more relevant with the emergence of industry 4.0.
Industry 4.0 together with its data has enabled us to gain relevant insights into not only when the failure of a machine occurs but also why it occurs. This data-enabled approach is called predictive maintenance. In the following paragraphs, we will provide relevant insights and a pragmatic approach that discusses which approaches exist, why one should start implementing a data-based approach and what the large hinder blocks are to adoption. We will also show an implementation and conclude with how the future research of this complex topic might look like.
Insight 1: Predictive analytics is the holy grail that industry 4.0 strives for in the upcoming years. However, many other techniques exist and incremental steps should be taken before a full implementation.
When we discuss the topic of industry 4.0 and predictive maintenance, we have to speak of failure models. These models try to diagnose, understand, and predict the failure times of a machine based on wear and tear. This level of wear is often specified as the remaining useful life (RUL) of a machine.
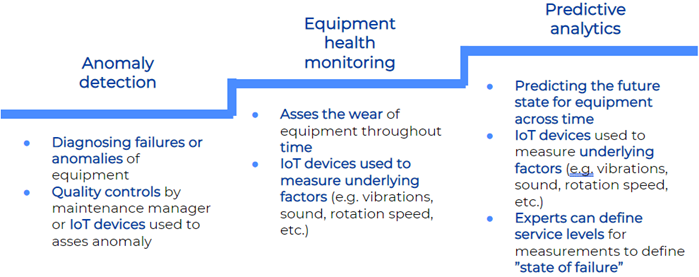
We identify 3 levels of sophistication:
-
Anomaly detection models diagnose failures and anomalies in the equipment. They are built using quality controls and simple IoT devices that can identify an anomaly, e.g. temperature or vibration.
-
Equipment Health monitoring models focus on assessing the wear throughout the full lifetime by constantly mapping the underlying factors.
-
The final level is predictive analytics where the model assesses the future state of the equipment through time. Here, the expert can define what they constitute as a “state of failure”.
Most organizations tend to be overwhelmed and start heavily investing in reaching the highest level and state-of-the-art models. They soon learn that they overinvested and are not able to realize the returns over time to make this profitable. On the other hand, that does not mean that you should not invest in predictive maintenance. Corrective maintenance, as we mentioned, is always a losing strategy. It is not only cost-inefficient, but it also burdens production and maintenance employees. We want to emphasize that building a sustainable predictive maintenance platform is done by taking incremental steps from the anomaly detection models through equipment health monitoring such that we can achieve strong functional predictive models.
Although the first two levels are a bit less exciting sounding from an AI perspective, they are fundamentally needed for a good understanding of the processes. A simple visualization of the underlying process and factors that influence machinery can already deliver impact. They offer more tangible results in the short term, which creates more goodwill from the business side to progress further into PdM. The level of sophistication of your model really depends on the cruciality of failures. For example, we already see that returns can be realized in industries with “expensive” or asset-intensive industries, such as infrastructure and pharma.
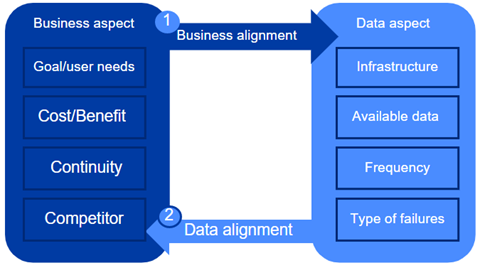
When it comes to successfully implementing a sufficient level of PdM, an organisation can have 2 strategies to approach the PdM problem. This framework subdivides the inputs into 2 large categories: the business aspects and the data aspects. The business aspect considers the costs and the benefits of knowing when maintenance takes place, the goal, user needs, what competitors do and the general strategy, etc. The data aspect considers all the available data, infrastructure, frequency, etc. Firstly, the business alignment strategy determines all the business aspect and adapts the data aspect accordingly to make sure we can deploy the right models. The data alignment strategy, on the contrary, fixes the current data aspect and tries to see how we can maximise the value of the business aspect given the current data situation. The business alignment strategy can be seen as a long-term vision and implementation plan while the data alignment strategy aligns itself more to offer incremental value.
Insight 2: Predictive maintenance goes beyond failure, it's also about utilizing resources right to prolong the remaining useful lifetime of equipment
Many organizations are aware of the existence of failure models. However, most organizations fail to understand that predictive maintenance is more than identifying these failures. It’s also about utilizing resources correctly and optimizing the parameters of machinery in such a way that it prolongs these failure times. This data is usually more accessible and available to organizations than the traditional failure approach to the model.
Insight 3: It’s essential understand the underlying fundamental challenges that hinder the implementation of industry 4.0.
Most organizations also believe that data is the most crucial reason that many organizations are not able to implement sophisticated models that predict failure. Despite data being one relevant reason, the adoption of PdM in the industry is lagging due to some fundamental challenges that emerge from many different aspects that hinder their implementation. We divided these challenges into 3 main pillars:

Insight 4: Despite the emergence of many other techniques in analytics, traditional machine learning techniques can still be considered the more popular approach
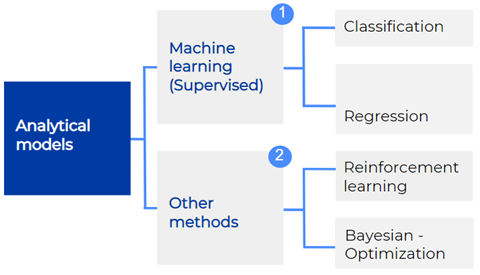
The field of analytics and AI have made a giant leap forward in the last 20 years. Despite the emergence of many other techniques in analytics, we recommend using conventional machine learning techniques for many reasons. We focused our research at Reinforcement learning and Bayesian optimization as alternatives and compared them to conventional machine learning approaches (ANN, Logistic regression, decision tree’s, etc.). We concluded that these conventional methods are still the most used in industry and for good reasons. They are highly researched, have a wide range of use cases, can be made interpretable and are used with relatively less data than reinforcement learning. Reinforcement Learning and Bayesian optimization can be used in many cases studied, but such a level of sophistication is not required for many use cases. Modelling techniques, however, are merely a small fraction of the overall pipeline within building a sustainable PdM pipeline. It’s more interesting for organizations to collect, clean and build insightful features rather than focusing on models.
Insight 5: Although the field of predictive maintenance is not mature, we can already see the emergence of future topics
Although current research needs to gain maturity, we can already see the emergence of what future research beholds. We identified a non-exhaustive list of three topics:

2. Our solution to a sanding machinery?
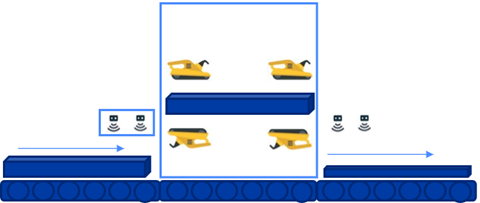
We demonstrated and used our techniques for a building solutions manufacturer who offers panels for buildings in their product portfolio. They use a sanding belt machine to get rid of excess and adjust the boards to right thickness. This ensures quality and is the last step in the process of creating the product. The organization has installed 2 IoT sensors before sanding recently and 2 after sanding that measure the thickness of the boards.
a) Despite large volumes of data, the necessary raw features are lacking
Due to the nature of our sensor data (4 sensors measuring thickness at that point), there is only a limited potential to build a model with the raw data provided, despite the large volume of data points. This pushes the need to build representative features that can measure the degradation of the sanding belt. Furthermore, as is common with PdM problems, a good target feature must be defined or constructed. We based our target feature on our output. More specifically, we looked at the amount of boards that needed to be discarded because they were too thick. Too many boards is an indication that the sanding paper within the belt is not effective anymore. In our case, we base the degree of degradation on 3 different states. We then define the target as the number of boards it takes to get to these states.
We start by counting the boards that are too thick (>8600 micrometres), according to the organisation's standards. We then define the 3 failure states (Bad, Medium and Healthy) by counting the number of these “discarded” boards in a consecutive window of 10.
b) Challenges as mentioned in the previous part

In our case, the manufacturing plant still largely relies on manual work and is prone to many anomalies:
- Boards may not be registered due to aggregated data on a second or due to boards touching together (mainly found before sanding).
- Boards may have a value on the right side but not on the left side because of the position of the boards
To tackle these complications in our data, we adjusted our algorithm to create dummy boards every time more boards leave the system than enter it. These dummy boards get the same value as the previous boards that were registered. Furthermore, the value on the other side of the board was adjusted if there is a 0 value on one side and a non-zero value on the other side.
c) Performance of chosen models
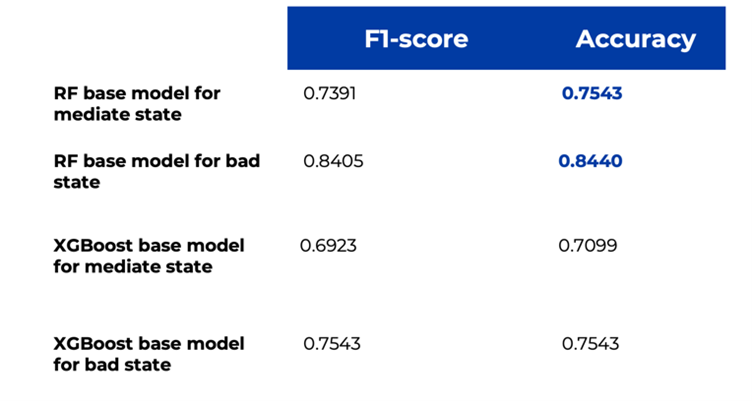
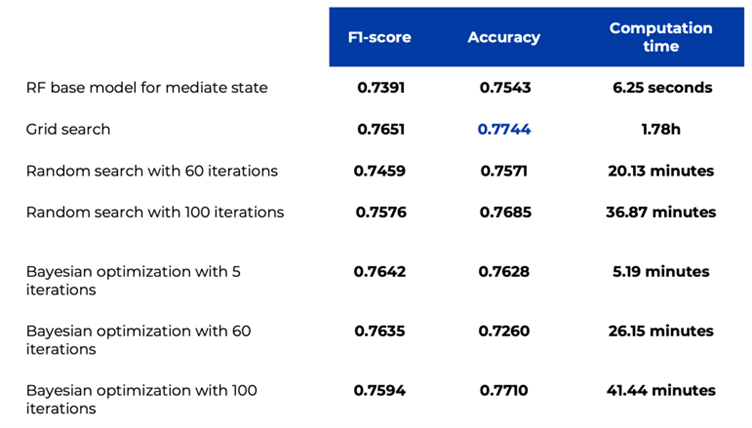
The baseline models for our case study were a RandomForest classifier and an XGBoost classifier. The initial performance in accuracy and F1-score for the RF classifier clearly outperformed the XGBoost on the test set. We can attribute this big difference to the fact that the XGBoost overfitted on the training set. To try and improve model performance and rigidity, we performed both random and grid searches and concluded with a Bayesian optimization. The best trade-off between computation time and performance is found in the Bayesian optimization, making it the most viable option for organizations to use.
In order to get some more interpretability in our models, we finished by using Shapley values to determine the effect of each variable on our predictions. These fell in line with our expectations. However, they pointed out the deficiencies of the collected data points again, something to take into any follow-up projects.
3. Predictive maintenance? What's next?
Although current research needs to gain maturity, we can already see the emergence of what future research beholds. We identified a non-exhaustive list of three topics:
