Creating a Dashboard is not always an easy thing. It requires a lot of collaboration between the consultant, end-users, management and the IT department. As element61, our goal is to deliver quality which means delivering correct data that the end users can rely on day after day. To guarantee the long-term correctness of data, one needs to thoroughly structure the back- and front end and have a verification method in place towards validating the data. As Qlik experts, we have the responsibility to get things right. Luckily, Qlik gives quick and developer-friendly tools to enable these validations. Additionally, we want to outline in this insight some tips & tricks on how to run and orchestrate such front- & back-end validations.
The front-end verification
Make sure the functional use cases are clearly discussed & documented
It is best practice to thoroughly detail the use-cases; something a developer ideally does together with the business end users. Use-cases typically define how a user will use the dashboard: i.e. which dimensions & metrics he wants to see, filters he will use, etc. Once these are detailed, testers can easily access each use case one-by-one. Note that use cases should be verified every time modifications are made to the data model. Going through the use-cases is very important to verify if the application responds well to every requirement that have been asked. This might include functionalities but also security rights: e.g. do you have access to sheet X, can you see object Z?
Tip: structure the documentation of your use cases:
Use cases can best be written as
“as a [User Type] I can/should see [Action] in order to [Goal]”
Or “as a [User Type] I can/should see [Amount] for [Selection”]
Create a quality dashboard for raw data
To know if the output data is correct, we base ourselves on the input data. This data serves as our reference which means if input data is wrong, the output data will be wrong. At element61, we offer the customer a quality dashboard that contains exclusively the input data, where each table is independent from the other. This allows simple verification by the developer as well as the customer. If the input data is wrong, it might be that incorrect data has been provided. On the other end, if the output data is wrong, it must be an incorrect logic by the developer. Therefore, a quality dashboard is very important and reduces discussions on the responsibility of the incorrect data.
Testers enjoy having the possibility to check on input data quickly and as often as they want. It is time consuming to manually verify and access every single source used on the dashboard. This dashboard will only be provided to the test users and will be a reference for the testers. Do not forget to test the quality dashboard to avoid errors.
Use existing documents for data validation
Documents such as previous/current P&L (for a financial dashboard) can be used to verify the figures at a high level. It is much easier to test on available numbers. It will show as well if the previous data were correct.
The backend verification
Only start working when business questions are well-defined
Preparation prevents rework. As such, it’s important to make sure that we only start to build our data model once we are sure it allows to answer the required business questions. A data model that displays correct - yet unnecessary - information remains useless. The data model must be built with the business demands in mind, and only contain the necessary data.
Perform basic aggregations on the main tables
Every fact table must contain the exact same number of rows as its raw equivalent. Similarly, joins should not cause data loss where there should not be any (e.g. a left join). This can be validated: i.e. some basic calculation can be made to compare the raw data with the aggregated/joined data.
Specifically, when using joins, a validation of the #rows an aggregation has, prevents the loss of any important data. Simple formulas such as =sum(amount), =count(customerID) and count(DISTINCT customerID) can be used.
Refrain from aggregations on key-fields
Qlik automatically links 2 fields when having the same name (also called keys). When we have a link between 2 tables, one should prevent to have an aggregation on key fields as Qlik will count on both tables. Therefore, it is likely that your aggregation will not be correct, and not reflecting your actual data.
Tip: To avoid any mistake, the “hideprefix” function must be used: i.e., when you label your keys with ‘%’ all keys will be hidden and thus can’t be used for aggregations and calculations. E.g. use %CompanyID instead of [Company ID]
Check for Information Density and Subset Ratio
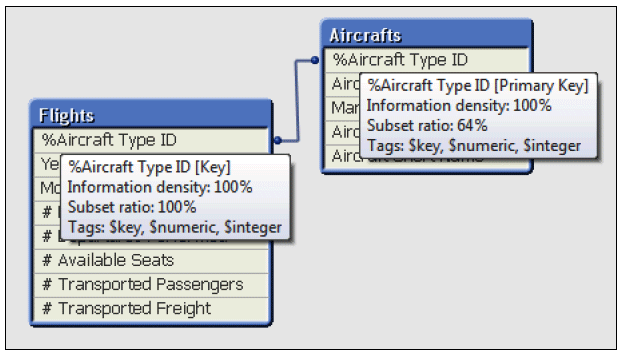
- Information density indicates the percentage of rows that contain a distinct value for a field.
- Subset ratio (only on key) shows the percentage of all distinct values for a field in the table compared to all the distinct values for that field in the entire data model.
Both indicators are paramount when verifying the data model. They indicate if the key chosen is a quality field between 2 tables. If there are no/little common values between the 2 tables, it means that the key cannot be used or that the key is not precise enough. It saves a lot of time and can be used to check a key before joining 2 tables.
Tip: The sum of subset ratio between tables of 100% means 0 common value between tables.
Check for connection strings in the Qlik script
Connections to various databases in Qlik is normal in a project. Errors can easily arise when changing source. It is important to check connection strings, and as well to show on the dashboards where the data come from, and which environment is used.
Tip: It is wise to keep connection strings in variables to avoid refactoring of code.
No syntax error doesn't mean no logical error
Logical errors are more dreadful than syntax errors. It’s hard to identify the logical errors compared to the syntax errors identification. An error in the parenthesis for a calculation, an unwanted concatenate, double loading the same tables, are mistakes that are easily made, and the first thing to check when unwanted numbers appear.
Check the filters working properly by verifying the data and associated data with it. With the help of the quality dashboard, it is easy to make selections on each independent table and compare the result using the filters on the dashboard.
Check the performance of Qlik based on different size of data load
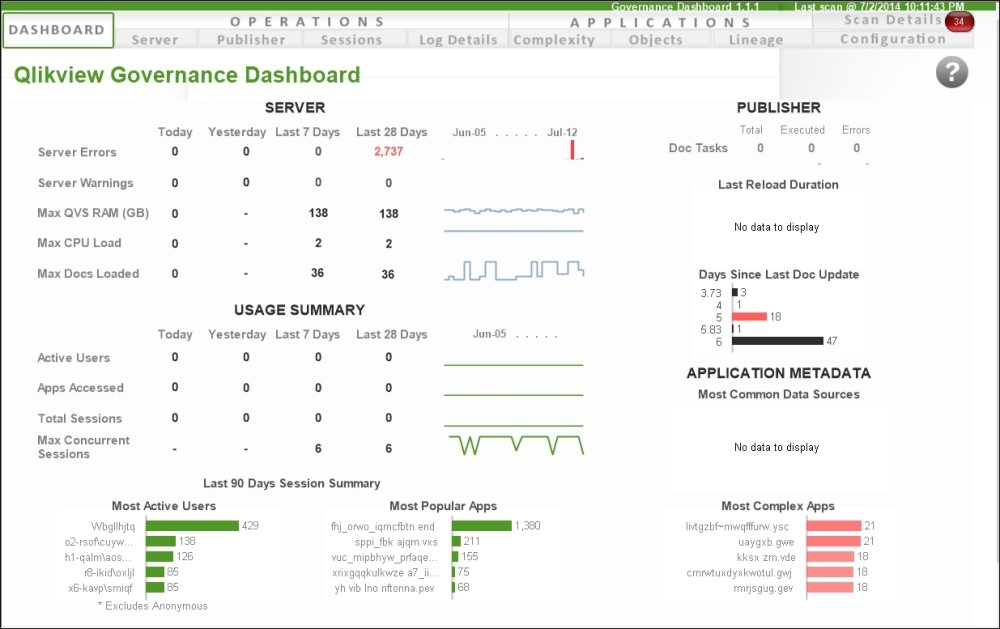
Performance of an in-memory system is paramount. A system showing low performances with test data will most likely be not useable on a production environment. Poor performances can be due to poor data modeling, undersized server, network issues, etc. It is important to test performance as often performance issues are due to poor data modeling and can be discovered by the amount of RAM and CPU that is abnormally high, especially during reload and display. Qlik provides powerful dashboards to verify data modeling and server size. It should be used and passed on to the IT department at the end of the project for appropriation.
Qlik Sense Governance dashboard
Create a "Debug mode" for testers
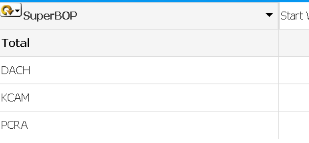
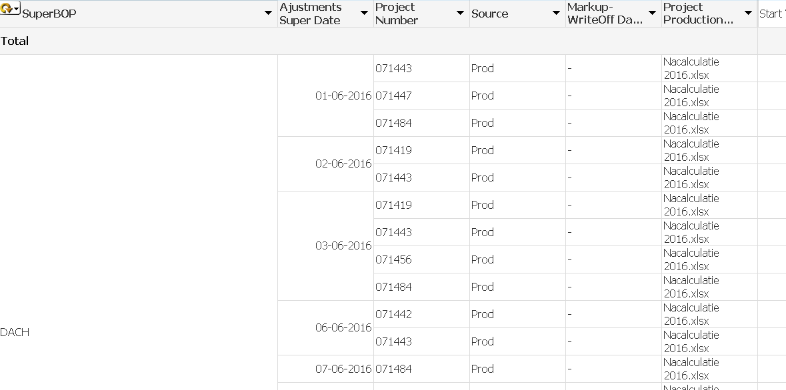
Testers will verify in detail the figures provided in the various dashboards. Instead of recreating a dashboard, hidden fields or sheets can be used to provide more details. These sheets/fields can be used by the testers when pressing a button that will be exclusively available on test environment. Adding extra fields avoids redundancy and allows testers to dig deeper into detail of every single measure or dimension.
Debug mode disabled:
Debug mode enabled:
Verify that your datamodel doesn't contain synthetic keys
When you join two tables, it can be done based on primary key and foreign key relationship based on a column. We can treat it as a normal join between the two tables. The problem starts when the joining is on more than one columns. The synthetic key scenario is when you have same column name for more than one columns between the loaded tables. The impact could be a datamodel with unnecessary data as well as waste of memory.
Tip: Avoid synthetic keys using Qualify, autonumber or alias functions.
Conclusion
A Qlik application can contain a lot of data and testing can be complex for both developers and testers. It’s important both work hand in hand through each stage of development as well as before going live to a production environment. The time investment for proper testing guarantees end users to have proper data in the Qlik applications.
Testing an application is paramount before releasing it to end users as they will make decisions based on the numbers provided. This investment in time and workforce is important as wrong figures create stress and risk of failure for the whole project. Trust must be built with users and management to use the application, and this trust can be built only if the dashboards answer their needs in terms of design, data and performance. Testing is key!

