Back in the years 2010, Scorecarding was very popular in Business Intelligence context, especially for automating KPIs in the context of Balanced Scorecarding, Six Sigma or other management paradigms. Most BI vendors had a –often separate- module for Scorecarding. It is exciting to see Scorecarding now arriving to Power BI.
Power BI Metrics – a functionality of Microsoft Power BI - is a simple way to track KPIs (Key Performance Indicators) against specified targets. It allows a business user to centralize metrics and track the progress of important business objectives. It is also an easy-to-use and visually appealing solution, allowing collaboration and engagement on the platform.
With Power BI Metrics, you can track the progress of any data that changes over a certain period. Data updates can be done manually by the business user or set automatically via a scheduled dataset refresh.
Metrics are grouped in a “scorecard”, which is a collection of goals and can currently –at the writing of this insight- only be set-up in the Power BI service. A preview feature is also available to set it up in the Power BI desktop app.
Below is an example of a scorecard.
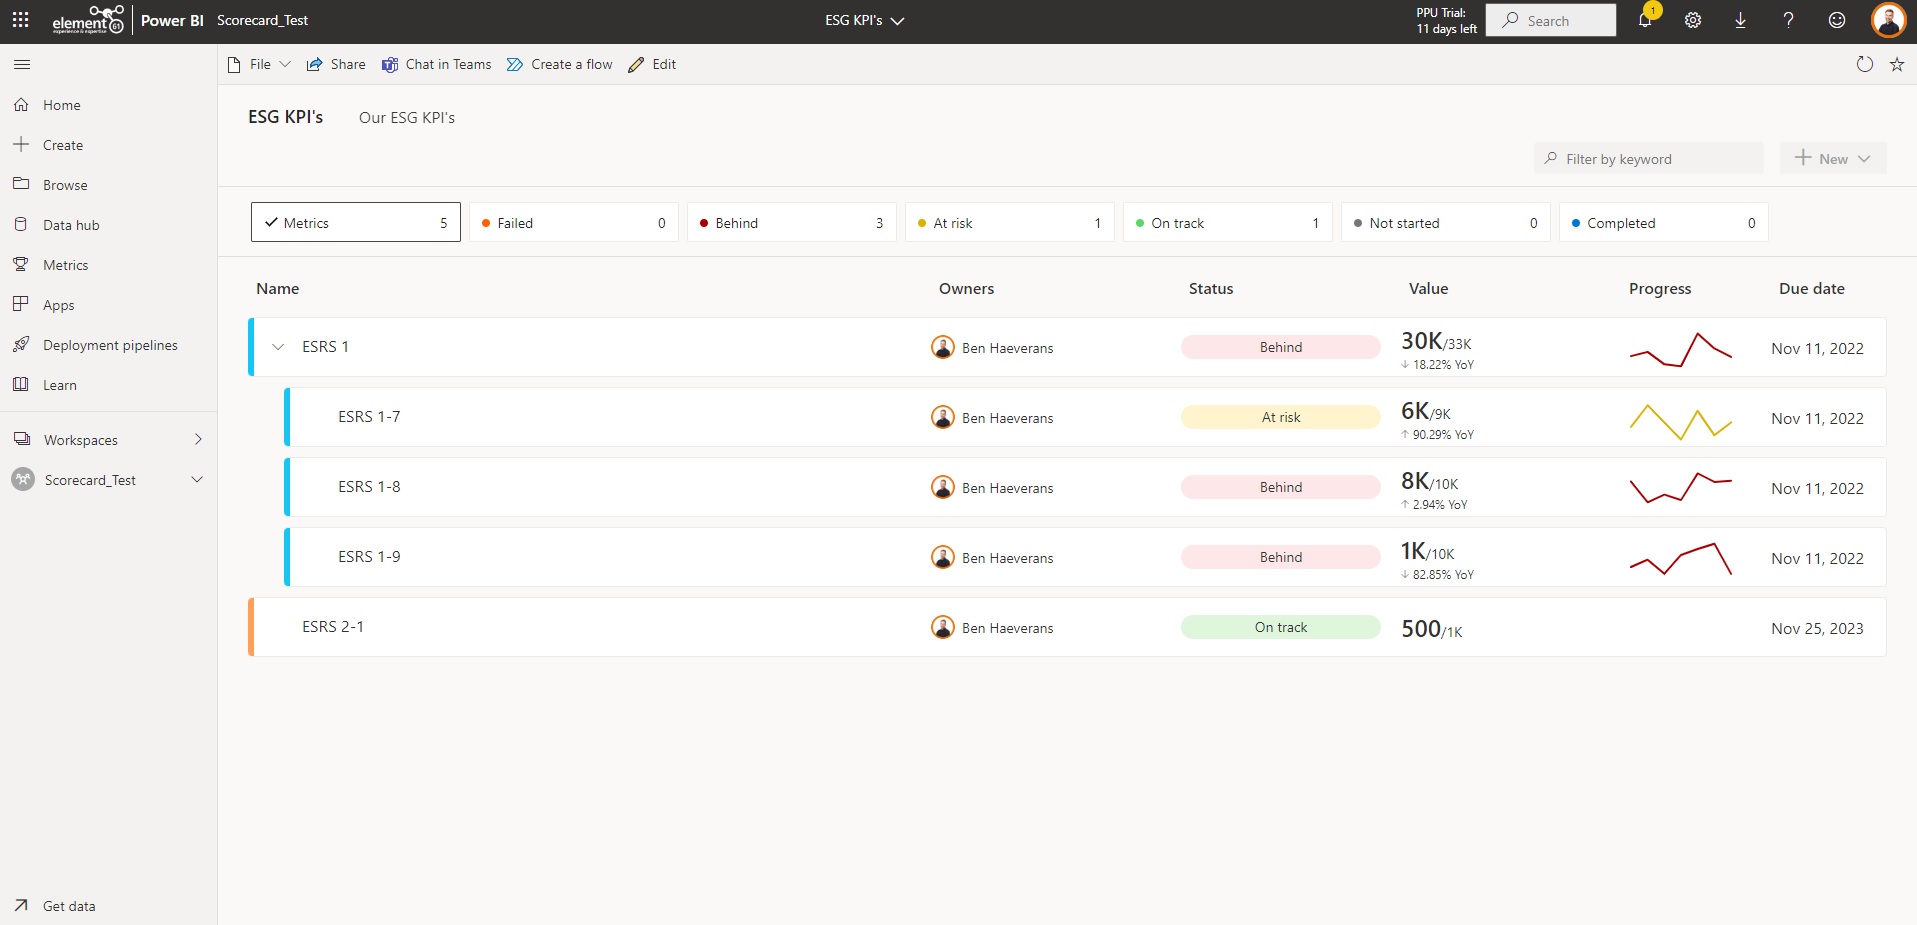
Figure 1. Example of a scorecard in Power BI Metrics
Why use Power BI Metrics?
As a business user, you might want to have an accessible and easy-to-understand solution to track KPIs and push updates to other users. Here, the Power BI Metrics come into play.
Power BI Metrics are a user-friendly feature made for business users in day-to-day use. In our opinion, the functionalities and buttons are straightforward, which makes it extremely easy to set up and get started.
Metrics can be customized to meet an organization’s specific needs with status rules and using subgoals. Colors can be assigned to each status category, indicating how the organization performs against the set goals.
With Power BI Metrics, you encourage more collaboration with your team and colleagues. Using notes, business teams can explain a certain change in the tracked value and, as such, start a discussion. New notes or comments are indicated by the remarks icon per (sub) goal.
Using Metrics, organizations can ensure that employees feel more engaged and involved towards shared objectives. Instead of opening one or more published Power BI reports and passively consuming them, goals can be stored in one place so that users can actively take part in the process of keeping goals up-to-date and take on more accountability for the value they bring to the organization.
Key functionalities of Microsoft Power BI Metrics
In this section, we highlight the most important functionalities that Power BI Metrics offer.
The following items will be discussed: adding and updating values, statuses, check-ins, subgoals, tracking cycles and permissions. This is what a goal looks like before any input:

Figure 2. Goal setting in Power BI Metrics
Adding and updating values
The purpose of a metric is to compare the current value to a target value. There are two ways of adding those two values to the goal:
- Add a value manually by typing it in the box.
- Connect to data from a published Power BI report. Establishing a connection with that report creates the opportunity to connect with very specific values of the visuals. For a visual with a drill-down and/or a drill-through option, the desired level and value can be chosen.
- Aggregate (SUM, AVG, MIN or MAX) targets or actuals from submetrics for top-metric
All methods can be combined in one metric, for example, a current actual value connected to a report and a manual target value. It’s also possible to use a metric with only a current value when there isn’t a target value.
The current value selection also supports time series data. Instead of starting to track from today on, goals will collect the historical data too.
One functionality we miss here is an autofill for the start date when selecting time series data. For example, when the first data point from the time series is March 01/03/2022, Power BI should automatically set that date as the start date.
To update a manually entered current value, a new check-in must be created (more about this functionality later). When using a manual target value, change it by going into edit mode, which can be found at the top of the page. A connected value is updated automatically when the dataset from the connected report refreshes. Connected data can't be overridden by a manual entry.
Statuses
It is important to easily spot how far actuals are removed from their targets when tracking multiple KPIs. This is what the status of a metric is about. A status can be changed manually or dynamically based on the values of the actuals.
Manually changing a status can be done with a check-in. A status rule is similar to an “if-statement” and can contain more than one condition. Unfortunately, status rule configurations can’t be saved and imported to speed up the process of creating similar rules. Also, the order of the status rules is important. The rule at the top overrides the ones below when a condition is met.
A status rule can be based on three different things:
- Value
- Date
- Value change
Here is a practical example. The ESG metric ESRS 1-7 sets a target for the maximum amount of CO2 emissions that our organization can emit within a specific timeframe.
When the actual value is below 80% of the target value, the green status states the KPI is “On track”. When the actual crosses the threshold of 80%, the metric is marked “At risk” in yellow. If the organization fails to achieve its goals, and the actual value is larger compared to the target, the KPI is tagged “Failed” in red.
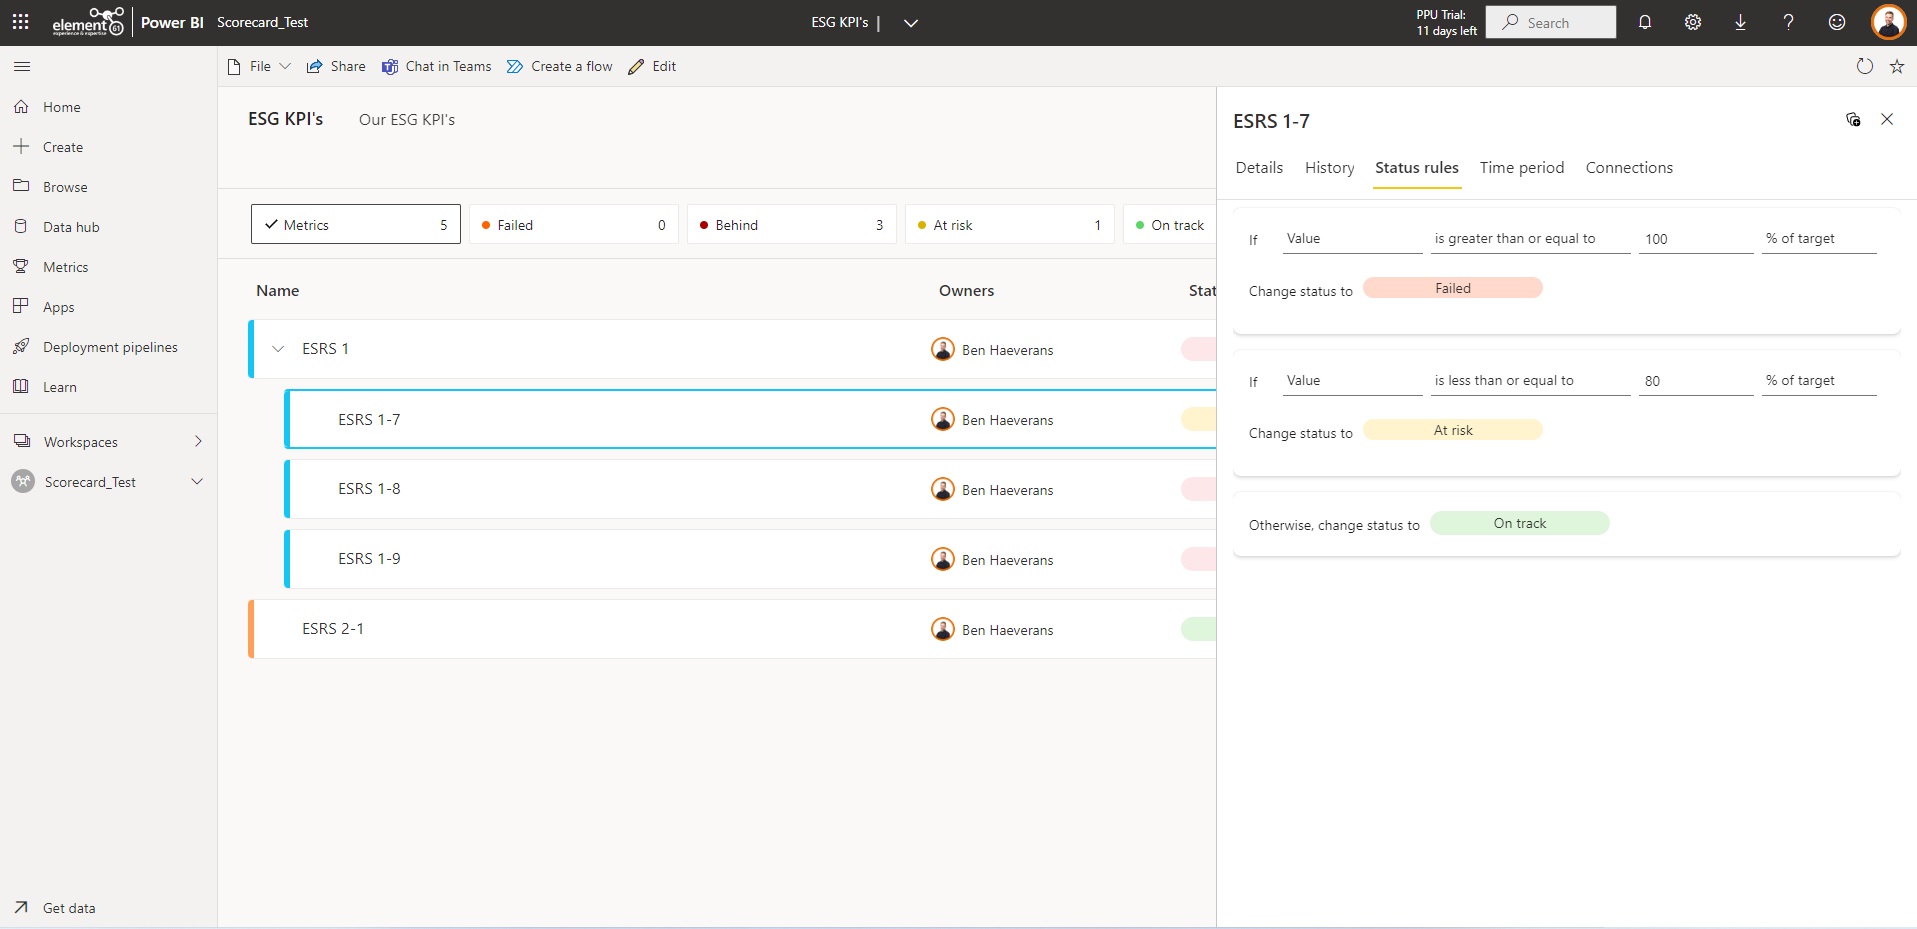
Figure 3. Setting dynamic status updates in Power BI Metrics
As a business user, you might want to adapt the terminology used for the statuses, so that they suit the terminology of the organization. This is now possible thanks to the Power BI update of March 2022.
The update included a new option to manage statuses where a user can change the names of existing statuses and add new ones too. For the different statuses, there are a limited number of colors to choose from.
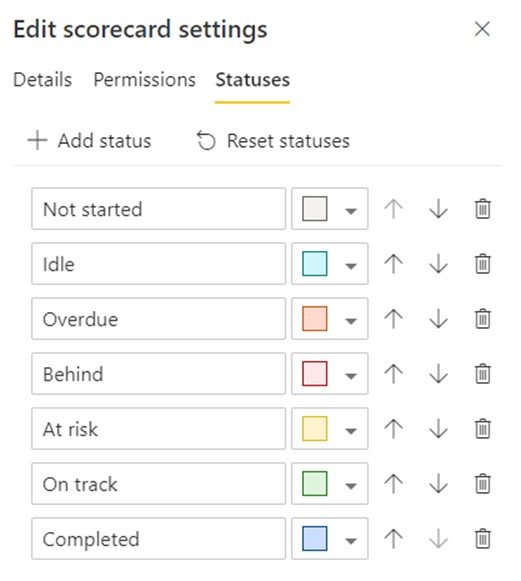
Figure 4. Define status categories for each scorecard
Check-in
A check-in can contain four things: a value, status, date and a note. Regarding the first two, it is important to keep in mind that the value isn’t adjustable if it is connected to a Power BI report, nor is the status when it’s controlled by the automated status rules.
Additionally, it’s possible to indicate the date for the check-in and add a note. A note can be used to, for example, explain a specific change from the current value. After adding a check-in to a goal, more than one note can be added to that check-in.
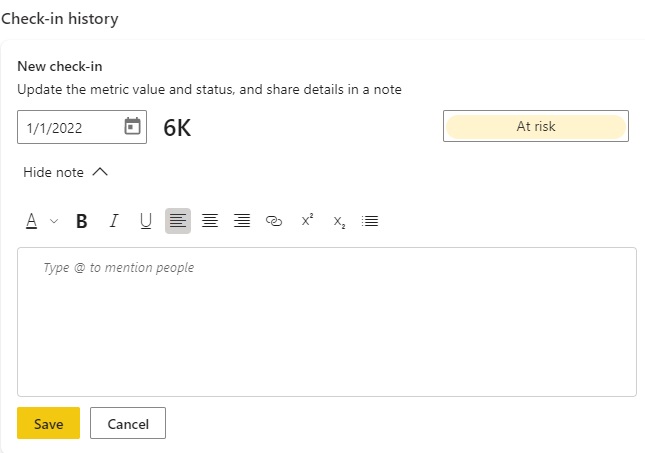
Figure 5. Manually add actuals with notes
Subgoals
Not every KPI consists of one metric, and sometimes it is necessary to have multiple subgoals. With Power BI Metrics, there are up to four levels of subgoals. The order and level of a goal and subgoal are easily changed by dragging the goal to the right place. Just like statuses, subgoals and goals can’t be duplicated.
It is important to note that the highest level of a goal does not aggregate the subgoals. A manual data entry or data connection for the main goal is necessary.
Tracking cycle
The visual from a metric is a great way to immediately see what the progress looks like. The tracking cycle setting of Power BI Metrics fulfils the need to see the visual update on a monthly basis, while the data is refreshed daily. This setting offers a daily (default), weekly, monthly, quarterly or yearly tracking cycle. It is important to point out that the visual shows the seven last available data points for the chosen cycle. This means that when using for example monthly, the visual shows data from the last day of each of the past seven months.
![]()
![]()
Figure 6. Aggregate actuals and targets by day, week, month, quarter or year
Permissions
Security and permissions are crucial within Business Intelligence solutions. While Power BI Metrics don't support row-level security (RLS) yet, it does have goal-level permissions.
They are managed with roles, which hold the specific permissions to view and update goals.
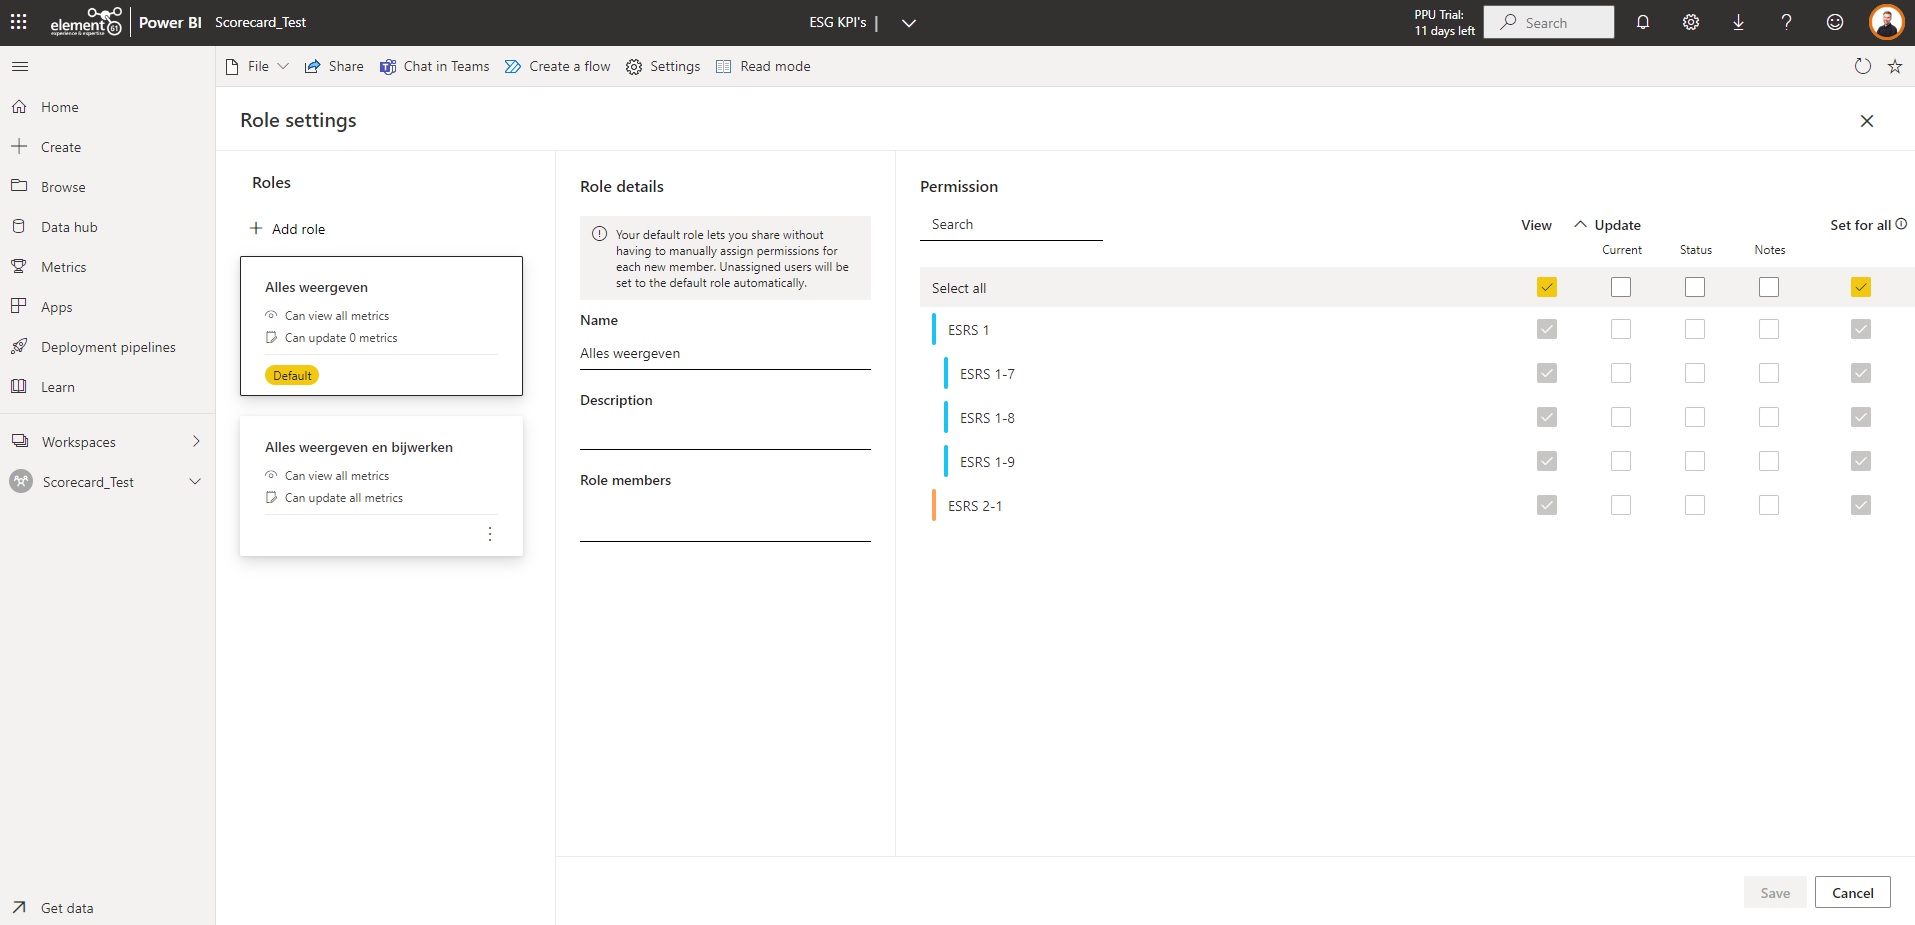
Figure 7. Set security roles for each metric
Extra steps
In this chapter, we point out possibilities and extra steps to add after setting up goals in the scorecard. They are here to take Power BI Metrics to the next level.
Power BI Scorecards in Microsoft Teams
Microsoft has a wide range of apps and has integrated many of them into Microsoft Teams. Power BI is one of those apps. Thanks to that integration, Power BI Scorecards can be added to different charts and/or channels to view and edit them from there.
Power Automate
Power Automate offers extra customization abilities. You can automatically create or adjust metrics, send email alerts, add targets or actuals, and more. Thus a Power Automate flow consists of a series of tasks that will run from the Microsoft cloud.
Report on top of Goals
All the data that ends up in the scorecard is automatically collected in a new dataset. With that data set, a report can be created on top of the scorecard.
Scorecard visual
The Power BI desktop app has a preview feature for a scorecard visual. It is enabled by going into the preview feature options. Then there are two options. The first one is to simply connect to a Scorecard created in the Power BI service. The second option is to create a new Scorecard in the app instead of regarding the service.
Creating a Scorecard in the Power BI app works exactly the same as creating one in the service apart from one significant difference. The app provides a lot of formatting options for the scorecard in general and the goals, like hiding (sub)titles, headers and changing colors and backgrounds whereas the service doesn’t.
There are two disadvantages of the scorecard visual:
- The formatting options don’t synchronize with the Scorecard in the Power BI service
- The visual lacks performance compared to goals in the service, it doesn’t work as smoothly
Pros and cons of Power BI Metrics and Scorecards
| + Easy and quick setup | - No autofill for a start date when selecting time-series data |
| + Encourages collaboration and engagement | - No option to duplicate a goal or status rule |
| + Specific value selection | - No RLS |
| + Custom statuses | |
| + Subgoals | |
| + Different tracking cycles | |
| + Microsoft Teams integration | |
| + Automation options with Power Automate |
What’s to come?
- Cascading of goals: this planned feature will make it much easier to roll out goals to various levels of a data model hierarchy, such as a geographical or product one.
- RLS (Row Level Security): according to Microsoft documentation, row-level security isn’t supported yet. This could mean that Microsoft has this on their to-do list, but it hasn’t appeared on any release wave yet, at the moment of writing this Insight.
Want to know more?
Want a quick demo of Power BI Metrics and Scorecards? We completed this Insight with a 20 minutes demo of all functionality.
Conclusion
We are excited about Metrics in the Power BI service. We recommend using it because with the help of this user-friendly feature KPIs can be consolidated, centralized and managed.
Sharing the scorecard will boost alignment throughout a team or organization. It also offers new ways to collaborate through notes and Microsoft Teams. In addition, the latest update that introduced custom status rules has great added value. Finally, we are looking forward to seeing what the future updates bring for Power BI Metrics and Scorecards.


