Where to find what’s new?
Before diving into the features, it might be a good idea to ask ourselves where to find what’s new. There are several sources where to find information on what Qlik has released or will be releasing shortly.
Qlik Help
There is a ton of content to be found on the Qlik Help page, not only limited to the What’s New pages. A distinction needs to be made between the Client Managed and the Cloud product.
- For the Client Managed product, Qlik releases a new version every couple of months. As of today, the most recent version is that of August 2022. With every release, you can find all the new features on their help page with the necessary explanation on how to use and implement them.
- The Cloud product on the other hand is constantly evolving. This means that as soon as a new feature is released, it’s available to use in the SaaS product, without the need to upgrade to the latest version. New features are released just about every week.
Qlik Cloud Home
In your Qlik Cloud Home, you might notice an icon at the bottom right popping up.
This gives access to the Connect & Learn menu, where you’ll find a wide range of content including:
- What’s new
- Onboarding guides
- Events & webinars
- Learning & demos
- Qlik Help
- Pre-release announcements
- Ideation
Note that they also have some pre-release announcements, so you can also follow what’s coming. Additionally, Qlik highly values the opinions and feedback of their Community, so they enable them to influence the evolution of Qlik’s product offering by way of Ideation. Here, as a Qlik Community member, you can suggest new ideas or vote on ideas from others. A great way to steer where they are going!
Formatted Export to Excel
A feature many of us have been waiting for is the formatted export to Excel. While the meme from a thoughtful Pablo Escobar seems to be very applicable here, a ton of users still love the export to Excel feature. Until February 2022, Qlik only exported the raw data, without any formatting or coloring. That’s now a thing of the past! Make sure to upgrade to at least the February 2022 version, if you’re still running the Client Managed product.

Figure - Pablo Escobar Meme
Images in Charts
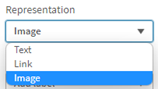 There are two ways to include images in charts. The first one, available since August 2021, is to add the image as a dimension or measure in a straight table. For each dimension and/or measure, the Representation can be selected, where one of the options is to represent the dimension or measure as an image.
A second way to use images in charts is to use them as a Custom Tooltip. Under Appearance > Tooltip, there is the option to have a Custom Tooltip. This way, you can completely choose what the tooltip is showing. One of the options is to add an image to the tooltip. The result of this can be seen in the figure below.
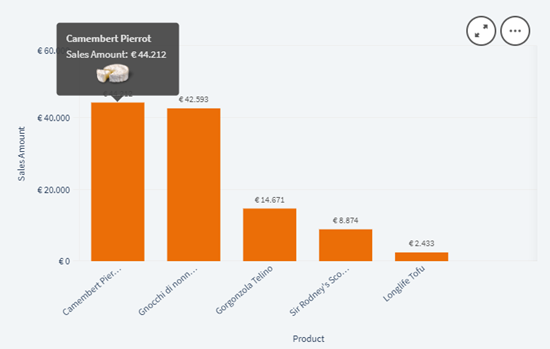
Figure - Image in Custom Tooltip
Qlik Mobile & Notifications
Qlik has a great mobile app, enabling you to access your Qlik reports at any time, any place. Again a distinction needs to be made between the Client Managed and the Cloud product because they have two different apps. The only reason is the difference in authenticating. Whereas on the Cloud app you can just log in with your normal user (e-mail) and password, for the Client Managed app you’ll need to ask your Qlik Sense administrator to enable you to connect to the environment.
Once you’re up and running, you’re able to access all your Qlik Sense apps in the usual interactive way, making use of Qlik’s Associative Engine, both online & offline. The true added value is found when using notifications in combination with the Qlik Mobile App. Let’s take a look at three different notification types.
- The most common notification is the data alert. This is triggered when a certain condition is met. An example could be to trigger an alert when product X has dropped below the minimum stock level. Note that data alerts are available by default on SaaS, but if you are still running the Client Managed version, you’ll need an add-on (which is to be installed separately) to use this type of alert.
- The second type of notification is the system alert. This is particularly useful for application owners, system management & IT. The most obvious example here is a reload failure. System alerts are a powerful tool to enable owners of applications to ensure things are up-to-date.
- Lastly, there are also subscriptions. With subscriptions, certain charts and/or sheets can be distributed via mail as PDF documents at pre-defined time intervals. Each e-mail contains a link to the Qlik app, enabling you to dive into further analysis, for instance through the Qlik Mobile App.
Qlik Connectors
Qlik has plenty of native connectors. Currently, the number stands at a total of 110 connectors, an overview of which can be found once again on the Qlik Help page. The longtime Qlik enthusiasts will probably have encountered the Qlik Web Connectors. This package required a separate installation for the Client Managed version and enabled you to connect to several social media and web-based data sources. As of the May 2022 release, these connectors are included by default in all the Qlik Connectors. Of course, on the Cloud product, these have always been included since the beginning.
Next to the obvious connectors such as the Microsoft SQL Server connector, some useful ones that you might benefit from could be
- Google Analytics
- JIRA
- MailChimp
- …
There is even a native Strava connector to analyze all of your running & cycling activities! It is highly recommended though to take a look for yourself at which connectors are included. If your required connector is missing from the list, this does not mean that Qlik is not able to connect to that data source. Don’t hesitate to reach out to us, we will gladly help you set up your data connections.
Easy Styling
With Qlik, you aren’t bound to the default theme. There are several ways to create a completely custom look & feel to your liking. This styling can be done on 2 levels, either on the app level or on the sheet/object level.
Styling on the app level
The styling on the app level has to be done through themes.
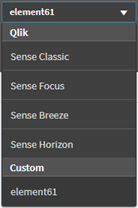
Qlik has, by default, some options for these. You can find the themes under App Options > Appearance > App theme. 4 default themes are at your disposal, as you can see in the image on the right. Notice that there’s also a custom theme, which is our very own element61 theme. The question is of course how to create such a custom theme.
A Qlik theme is a zip file containing 3 files: a QEXT file, a JSON file, and a CSS file. It’s not required to know these, because there is an easy way to get started, by using SenseTheme. Here you’ll find an overview of predefined themes which are further customizable, or you could start from scratch to build your very own theme. This is a completely no-code solution to create Qlik themes. Once you’re satisfied with the result, all you have to do is download the theme as a ZIP file, and import it into your own Qlik environment through the Management Console. The more tech-savvy among us can then continue to change the theme by editing the individual files within the theme.
Styling on sheet/object level
Next to Qlik themes, which impact your complete app, you can also change individual sheets and/or objects. There are once again multiple options to achieve this. Firstly there is the BeautifyMe extension, developed by Ivan Felipe. This extension allows you to completely change the layout of your sheet without writing any CSS yourself. Simply add the object to your sheet, and play around with the settings. Beware though, that this is an extension, so it might become unsupported in the future. This is in contrast to extensions that are part of the Trusted Extension Developer (TED) Program by Qlik. These extensions are officially recognized by Qlik and are therefore also supported, today and in the future.
Qlik has also a native way of adapting the CSS on the sheet/object level. This can be achieved by using the Multi KPI Object. By using this object, under Appearance > Styles, you can insert some CSS applicable only to that sheet where the Multi KPI Object is added. This is also a great way to test out some code and settings on the sheet level, before integrating this into your own custom theme.
Conclusion
The list of features could go on and on, but we decided to keep it at 5 for now 😉. As mentioned in the beginning, Qlik’s product offering is evolving very quickly, as is the rest of the market. Therefore, it is vital to stay up to date through several sources. At element61, we try to stay on top of it as much as possible to be able to advise the most useful features to you and your organization. For this purpose, we organize in-house knowledge-sharing sessions, give training sessions for you and your co-workers, produce content such as these insights and organize a yearly Qlik Analytics Day where we update you on everything there is to know about Qlik.
For further questions, don’t hesitate to contact us through our website, LinkedIn, or any channel you like.