Introduction
Drilling across different fact tables is a very important technique when analyzing data from a data warehouse. It gives us the possibility to analyze facts from different fact tables using conformed dimensions.
When using Analysis Services Multidimensional, you can only drill across if the fact tables are modeled in the same cube. This is however not always the case. In this insight, a method will be described on how you can still drill across multiple cubes by using the free Power BI Excel add-in called Power Query.
Drilling Across
Most data warehouse systems are either modeled using a multidimensional approach – using dimensions and fact tables – or they have a multidimensional layer suitable for reporting. Typically this reporting layer consists out of one or more star schemas, where a star schema is a fact table referencing one or more dimensions.
Usually a star schema corresponds with a data mart. Different star schemas can be linked together with the use of conformed dimensions. Conformed dimensions play a pivotal role in a data warehouse architecture, since they can be used to perform so-called "drill-across” analysis. Drilling across allows us to do powerful analytical work across process & departemental boundaries and it allows us to answer questions such as:
- If the process quality goes up in manufacturing, do we get more sales ?
- If sales do go up, do we get more or less telephone calls at the service desk ?
- How are the actuals comparing against the budget and the forecast ?
- …
In short, drilling across enables us to analyze facts from multiple fact tables (and thus multiple star schemas and data marts) in one single view. Drilling across is usually a two-step process:
- Getting the data from the different fact tables
- Merging all of the result sets together
Some tools can do this automatically for you, such as SSAS (SQL Server Analysis Services), while in other solutions you have to do it yourself, for example by writing an SQL query.
Drilling Across and Analysis Services Multidimensional
In Analysis Services Multidimensional, drilling across is straight forward if the fact tables – or measure groups as they are called in SSAS – are included in the same cube. The following screenshot depicts a pivot table with data from the AdventureWorks sample cube.

As you can see, it displays data from the Internet Sales measure group and the Reseller Sales measure group. Both measures come from two different fact tables, but they can easily be added into one analysis, because both measure groups are included in the same cube. All you have to do is select them from the Pivot Table field list.
But not all measure groups are always in the same cube.
Maybe two different cubes were built because a big cube with everything in it was too complex or too unclear from a business user’s perspective. Or the cubes were built by different teams.
Whatever the reason is, sometimes you want to drill across different facts but they do not belong to the same cube. Suppose we have two cubes, called InternetSales and ResellerSales, and we want to check the sales numbers for both sales channels. The problem is that in Excel, you can select only one cube at a time for your Pivot table, so you have to choose.
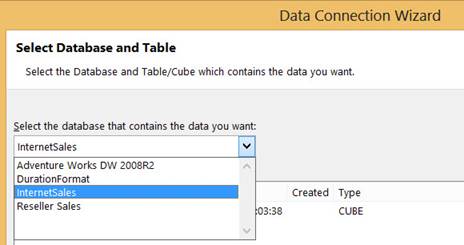
How can we drill across our two cubes, without building an entire new cube ? A solution is today provided by the use of Power Query.
Power Query
Power Query is a free Excel add-in, part of the Power BI family. It can be thought of as a self-service ETL tool right inside Excel. It has a wide array of data manipulation options and it can read from dozens of different sources. The add-in can be downloaded here.
Since November 2014, Power Query can also connect to Analysis Services Multidimensional (make sure you have Power Query up to date). Chris Webb wrote some interesting blog posts about it: Power Query Now Works With SSAS and A Closer Look At Power Query/SSAS Integration.
An important feature to remember is that some operations in the Power Query editor – filtering or sorting data for example – are not performed in Excel itself, but rather on the SSAS server. So if you filter on a dimension attribute, the SSAS server will do this and it will sent the results back to your Excel sheet. This means you can take advantage of the processing capabilities of the server while maintaining good query response in Excel.
Reading the Data
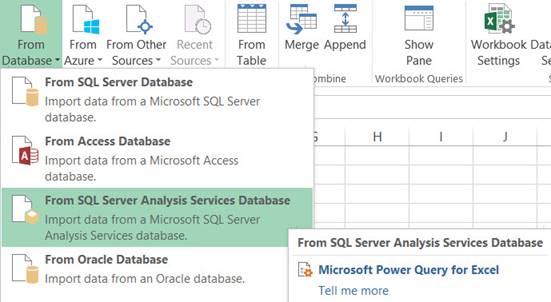
Fetching the necessary data for our analysis through Power Query is straight forward. First you select Analysis Services from the sources menu.
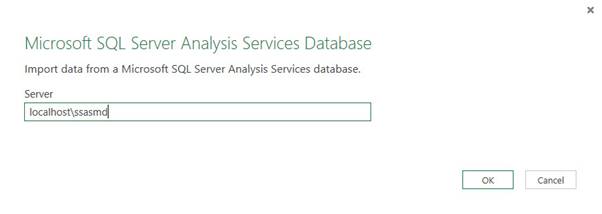
Next up, you have to enter the server name.
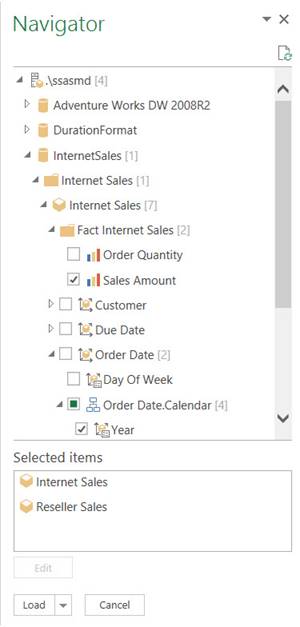
When you have connected to the server, you get a list of all the present databases with their cubes, dimensions and measure groups. Here we are going to select the Sales Amounts, the Product Categories and the Order Year for the analysis.
When you hover with your mouse over one of the selected items, you get a preview of the data:
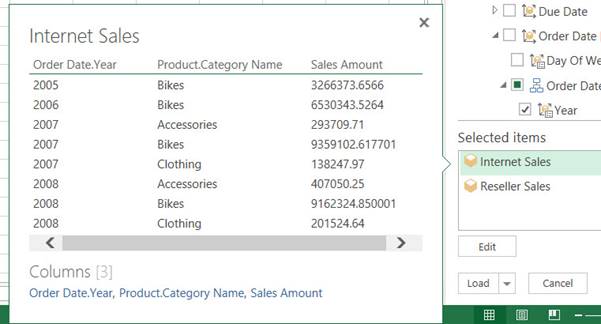
By clicking "edit”, we are taken to the Power Query editor where you can add transformations to the query. You can filter and sort data, remove data anomalies or add new columns. In this example, I filtered on the years 2007 and 2008.
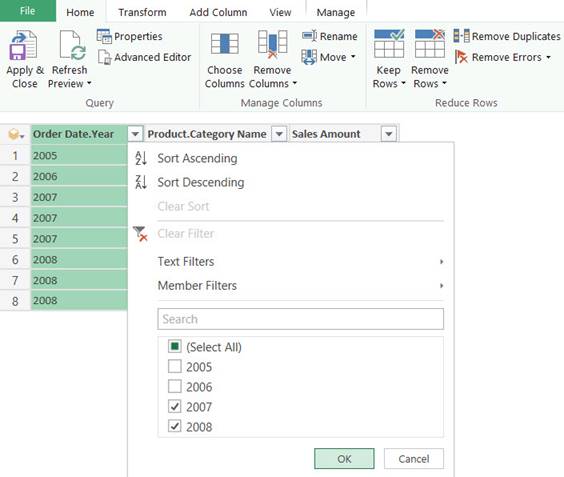
As mentioned before, this filtering will take place at the SSAS server and not in the Excel workbook.
The Reseller Sales query is filtered on the same years. To go back to the Navigator, click Apply & Close in the Power Query editor.
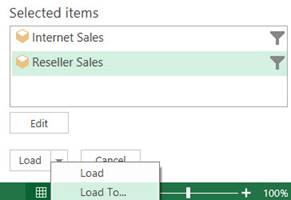
At the bottom of the Navigator is the Load To… button. Clicking this will take us to a dialog where we can choose how the data is loaded to the Excel workbook.
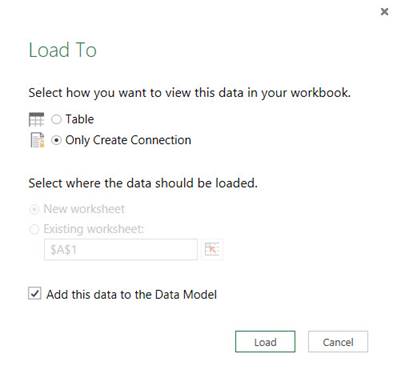
- Table: Power Query will load the data directly into an Excel sheet, where it will be formatted as a table.
- Only Create Connection: this option is useful when you don’t directly need the data. For example, when a query is only the first step in a series of multiple steps and the query will be re-used somewhere else.
- Add this data to the Data Model: when this box is selected, Power Query will also load the data straight into Power Pivot.
For this example, we’ll only create the connection. You could also load the data into Power Pivot and link the two fact tables together using relationships. However, relationships in Power Pivot are currently limited, as compound keys (multiple columns) are not supported. Power Query has a more flexible approach, as we’ll see in the next section.
Merging the Data
After Power Query has done processing, it will add queries as an object to the workbook. Any time you want, you can refresh the data or load it to a different destination.
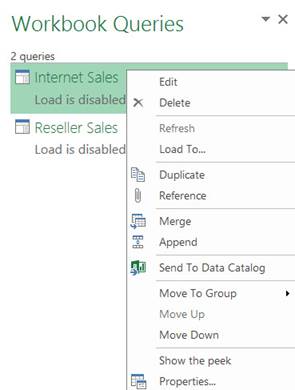
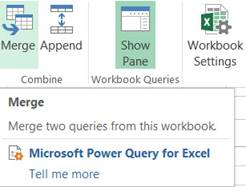
Power Query has the great option to merge different queries together, which will be the last step in the drilling across process.
In the Merge dialog, you can choose two queries. Creating a relationship is done by selecting a column from the top table and selecting a matching column from the bottom table. While holding CTRL, you can select multiple columns which enables you to create multi-column relationships, a big advantage over Power Pivot.
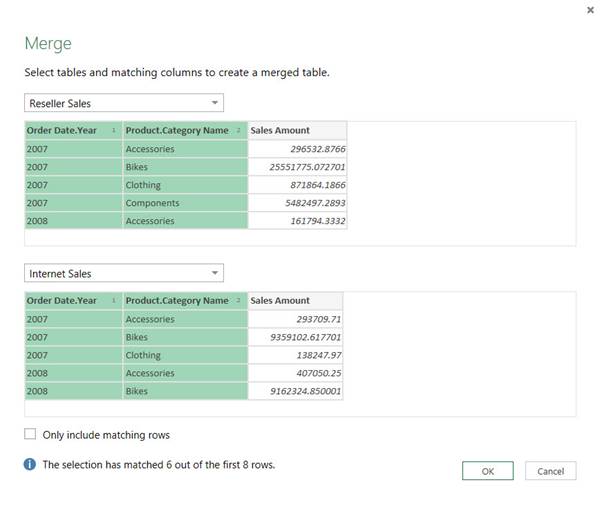
The top query will act as a table like in a left outer join. At the bottom of the dialog, there is a checkbox that allows you to include only "matching rows”. This would make the merge like an inner join in SQL. When clicking OK, a new query object is created. In the query editor we can see that the bottom table from the merge has been added to the top table, but it has yet to be expanded.
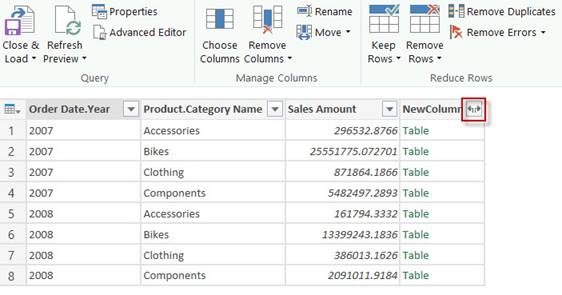
By clicking on the double arrow icon, we get to choose the columns we wish to add to the top table.
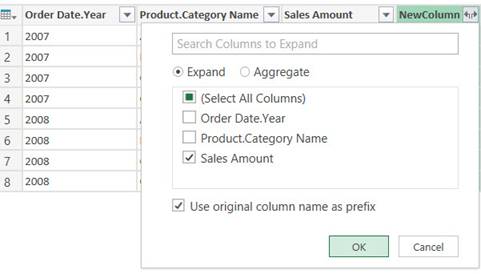
After adding the Internet Sales Amount column, you can see that non-matching rows get a NULL value.
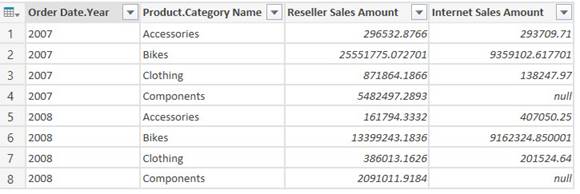
All that is left to do is load the query to a workbook and we have the results of our drilling across exercise:

You could also load the data to Power Pivot, so you have the full capabilities of Power Pivot and its pivot tables and pivot charts at your disposal.
Note
Remark that the merge in Power Query behaves as a left outer join or an inner join, not like a full outer join like you would expect when you want to drill across. To circumvent this, you could create a query first that just holds all possible combinations of the necessary dimension members first and then merge this with the facts. As a final step you could filter out all rows where no facts have been found.
Conclusion
Often business users require data from different Analysis Services cubes in the same analysis or report. Prior to Power Query becoming available, this was not possible unless a new combined cube was created, often by the IT department.
This insight has shown a new and easy way for a business user to drill across different Analysis Services Multidimensional cubes using Power Query. There are three easy steps to follow:
- Extract the data out of the cubes
- Merge the result sets
- Load the final result set directly into an Excel worksheet or to a Power Pivot model


