(written by Kjell Vanden Berghe - element61 Trainee in 2019)
As a student in Business engineering: data analytics I wanted to gain more practical experience in data science and data engineering. After I found out that element61 has a team that specializes in data science and strategy, I knew it was the perfect place to further develop my skills and passion for data science. Prior to my internship I already had some experience with machine learning and deep learning, but the extent of the data engineering part of a project wasn’t known to me. Data engineering includes the data collection, data structuring and cleaning, so in short collecting data through pipelines and transform it into formats that are usable for data scientists to perform data analysis and predictions.
What I did during my internship
The purpose of my internship was to leverage open mobility data to predict traffic congestions on the Flemish roads. The Flemish Government offers a real-time data source with mobility data on 584 locations. My job was to connect to this source and integrate the data into a modern platform with fully automated pipelines and leverage it towards predicting traffic congestions.
The use-case
The objective of the internship was to predict the traffic intensity at a specific time and location and enable people to choose routes where there are the fewest traffic jams. Speed seemed to be the best target for predicting the traffic: it gives the best indication of how much traffic there is and is most likely the easiest to be implemented in navigation programs in the future.
The available data: Open Data
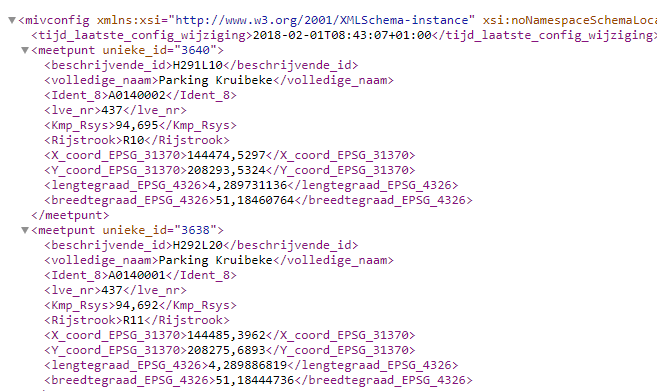
The open data is available as an XML file (traffic data) and contains real-time info about highways and roads in Flanders, such as speed per vehicle class, intensity, etc. Another XML file (configuration) contains specific information about the measuring location (detection loop) such as the coordinates, description etc.
Sample of the data (unstructured):
Next to the open data sources, we also use weather information as it's a very important factor for the traffic intensity, and also influences the speed. We therefore choose to include it in our prediction dataset. By using the Darsky API in a Python script, weather info is collected for every detection loop.
First step: data gathering
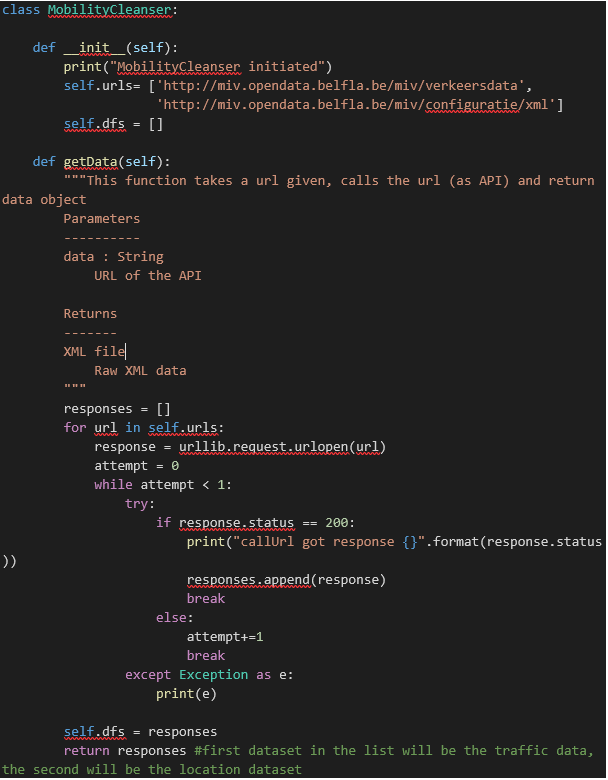
The XML files had to be combined and transformed in a way that it becomes usable. The URL gets called and the XML saved, operations are performed to structure the raw data into a cleaner Pandas DataFrame (not the actual data cleaning part).
Here is a piece of Python code for exporting the XML file from the URL:
Second step: Automation of data gathering
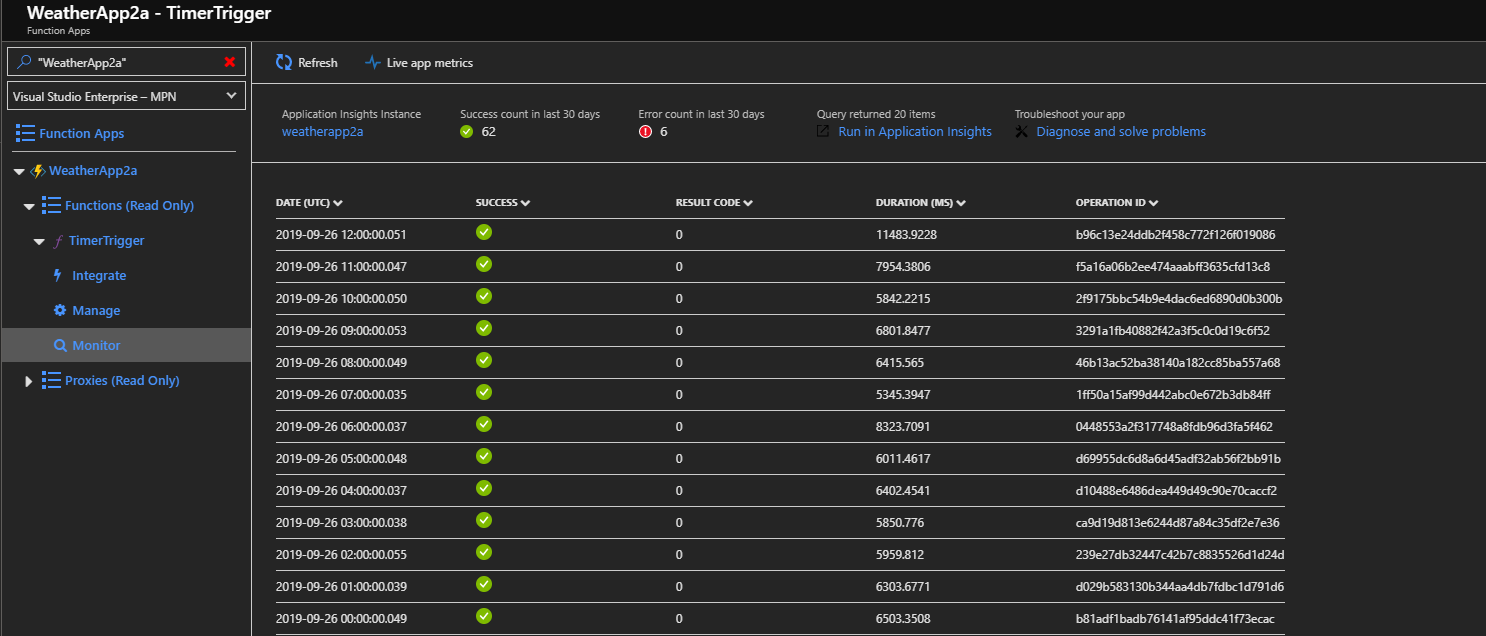
Since the content of the open data gets updated every minute it was important to store the collected data permanently, in order to have historic data that allowed me to make predictions. Through an Azure Function App the data gets automatically collected in the cloud every 15 minutes and gets stored in an Azure Data Lake Store. For the weather data there is another Azure Function App running that gets updated every hour. We limited the collection of weather data to an hourly rate due to restrictions in number of calls per day of the Darksky API. The mobility data and weather data are stored as .parquet files in subfolders: year/month/day/hour/minute. For example the data collected on 29 September 2019 at 16.00 is stored as such:
This is an example how the weather App looks like inside Azure:
Third step: Data cleaning
The data isn't clean as such; we'll need some data cleaning. The data - for example - requires to add date features such as if a certain day is a holiday, school vacation, day of week, etc. We also turns categorical variables into dummy variables, so every value of a categorical variable becomes a new variable with value 1 or 0; this is also known as one-hot encoding. One-hot encoding allows us to format data such that machine learning algorithms can handle categorical variables. An illustration of our one-hot encoding:
Finally the mobility and weather data need to be merged into a base table.
Fourth step: Automation of Data cleaning
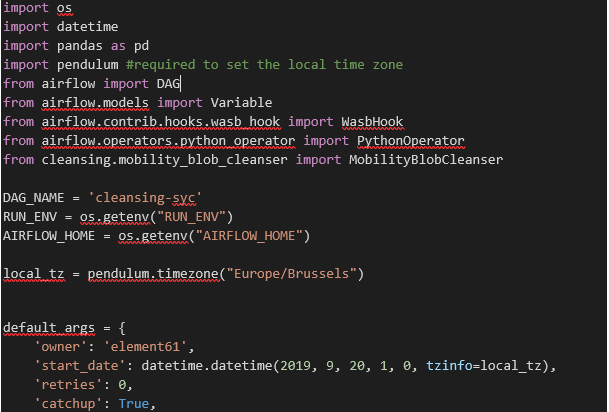
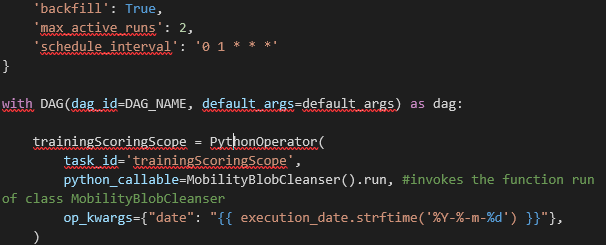
We want the flow of data to be continuous. Therefore, we decided to use Airflow as a platform where you can schedule and monitor workflows (data pipelines) through DAGs. A DAG or Directed Acyclic Graph is a collection of tasks that you want to run. You can choose things such as start date of a DAG, the schedule interval, etc. A very simple example of the DAG for cleaning data:
As such, we set-up an automated cycle where every hour the data is collected, cleaned and stored into the data lake.
Fifth step: Data discovery
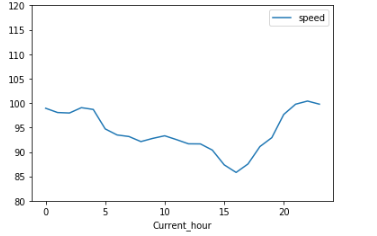
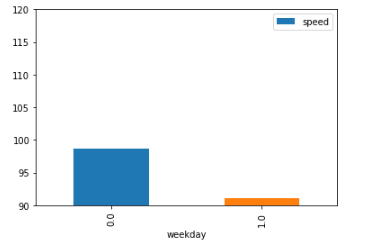
Before we perform any machine learning, it is always interesting to make some statistical plots between features and the target (speed) to define the potential features that we might include in our models. Here as some of my findings:
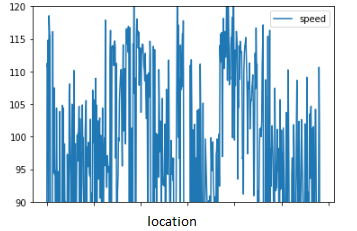
When the average speed over all locations gets plotted in function of time it is clear that there are peaks in the morning and especially in the evening between 4 and 5 pm. At night the average speed is the highest, which makes sense.
The average speed during the weekend (on average 100 km/h) is around 10km/h faster than during weekdays (on average 90 km/h).
There are huge variations in average speed between the different locations, which means it makes sense to make predictive models for all locations separately, instead of one model for all locations.
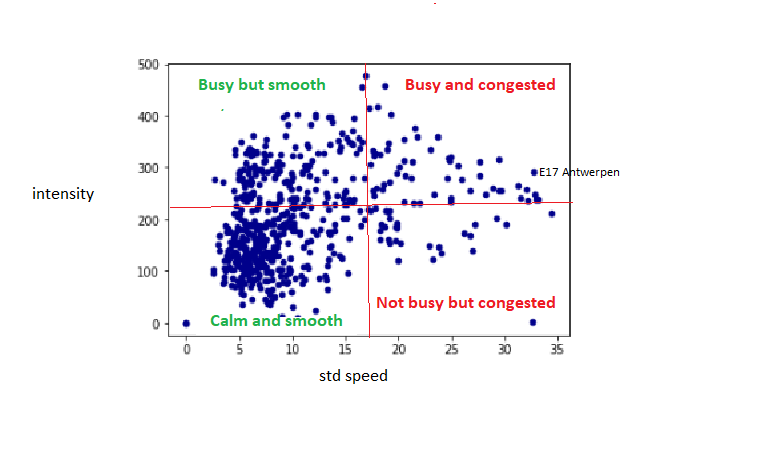
When plotting the standard deviation of speed and the intensity of the locations, we can detect four quadrants and split up our scatter plot as such. The quadrant that will be focused on is the one on the upper right (high intensity and big variations in speed). This is the situation where people get frustrated and what we want to solve.
Sixth step: Machine Learning
To predict traffic congestions we need a Machine Learning model in the type of time-series Regressions. Our objective will be to try to predict the speed index for a specific time and location (at least 7 days ahead).
We decided to train a different model for every location so a total of 584 models were developed using Random Forest Regressors. Since new cleaned data becomes available every day, the model gets retrained every day (through a DAG in Airflow). As more and more data becomes available the model becomes better in predicting the speed over time.
Seventh step: Interpretation and use of predictions
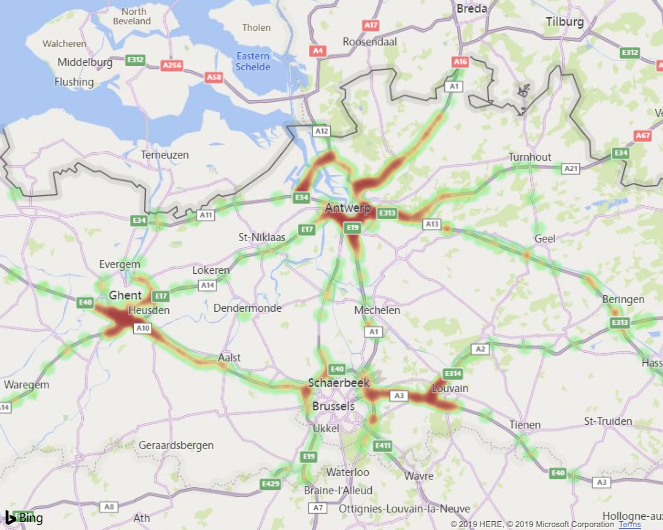
Speed predictions are made every day for every hour for the coming 4 days. Since comparing speed between locations doesn’t say much on it self, e.g. on the ring of Ghent you will always drive slower than on a highway such as the E40, the predictions are compared with the maximum speed of the location. The higher this number the less traffic, the lower the more traffic (this parameter is called fluency). The results are displayed in Power BI as a heat map, where red means that the speed is lower than the maximum speed and as such, there is a lot of traffic and green means no traffic.
What I learned during my internship
- Python is one of the most important programming languages for data science
- There are numerous Python modules for about everything you can think of
- If you want to loop through your data, standard loops (for, while) are very slow, pandas and numpy vectorisation are much faster
- The data engineering part of a data science project can not be underestimated; it takes about 80% of time of the entire project; making predictions is rather easy by making use of the Python library Sci-kit learn.
- Without technologies such as data lakes or blob storage you can’t collect massive amounts of data (big data)
- A data lake is a repository in the cloud where you can store folders and files that don’t have to be structured in any way and can contain any file type.
- Instead of saving pandas DataFrames as .csv files in the data lake, .parquet are much better because they are a lot smaller in size and optimized for read and writes.
- Azure Functions Apps are very interesting to make your code run automatically, and only requires some monitoring to check if everything still works like it should.
- To turn Python code into Azure Functions it is very important to specify your timezone if you use timertriggers, because when you run the code locally it automatically runs in your timezone without the need to specify it. But when you deploy the function the app runs in the UTC standard timezone. This problem can be overcome with the pytz module in Python.
- Apache Airflow is great for scheduling and monitoring workflows and it is open-source
- The more data you collect the more accurate your model will become. At the beginning you may be plagued with an overfitting model. So retraining your model over time is very important.
