This insight was initially published in December 2022.
At the end we provide an update on the new functionalities added since.
A sense of urgency is growing while the rate of global warming is rapidly increasing. Identifying and actively mitigating greenhouse gas emissions is key to halting the rising global average temperature level. On the organizational level, this requires varying sources of data and extensive calculations to remove ambiguity and correctly account for all GHG (Greenhouse gas) emissions.
This Insight explains how Microsoft Sustainability Manager can guide your organization in this process. The platform provides out-of-the-box solutions for configuring the data transformation that is required to calculate emissions. It unifies data from various sources, streamlines data ingestion, and simplifies emission factor calculations and unit conversion of accompanying activities. Meanwhile, the Sustainability Manager still retains full control over every step.
Would you like to know how it works?
A first look at Microsoft Sustainability Manager
Before we are ready to start exploring Microsoft Sustainability Manager, an organization must identify the internal data sources that are required to transform their activities to greenhouse-gas emissions.
In many cases this is part of an ESG roadmap exercise in which the organization identifies relevant material topics, defines KPIs, plans reduction targets, and sets the short- and long-term strategy for integrating ESG in the operations of the organization. Therefore Sustainability Manager can be a solution that supports ESG reporting, specifically for greenhouse gas-related KPIs within the “E” of ESG. Alternatively, the platform can also be used for Carbon Accounting purposes.
Once the above goals are set, it is time to access the platform. Microsoft Sustainability Manager is cloud-based and is built on top of Microsoft Dynamics 365.
This platform is accessed online through a browser with Microsoft 365 user credentials. Browsers on Android- or Apple-based smartphones or tablets are also supported. This enables the user to access the platform from anywhere with an internet connection on multiple devices. It is worth noting that there is no desktop application available to access the platform. Once logged in you arrive at the Homepage tab (see figure 1). This landing page consists of a dashboard that provides a general overview of all emissions.
Navigating around in Microsoft Sustainability Manager is quite easy. At the bottom left of the screen, there is a dropdown field that consists of the following main components: analytics, data, settings, and help and feedback. Each page subsequently contains several tabs in the grey area on the left side of the screen which you can use to navigate around.
The teal-colored bar on top contains several buttons such as the settings, configuration guide, account settings, advanced search or Microsoft Teams integration. Some of these icons bring up an additional pane on the right. More on this later.
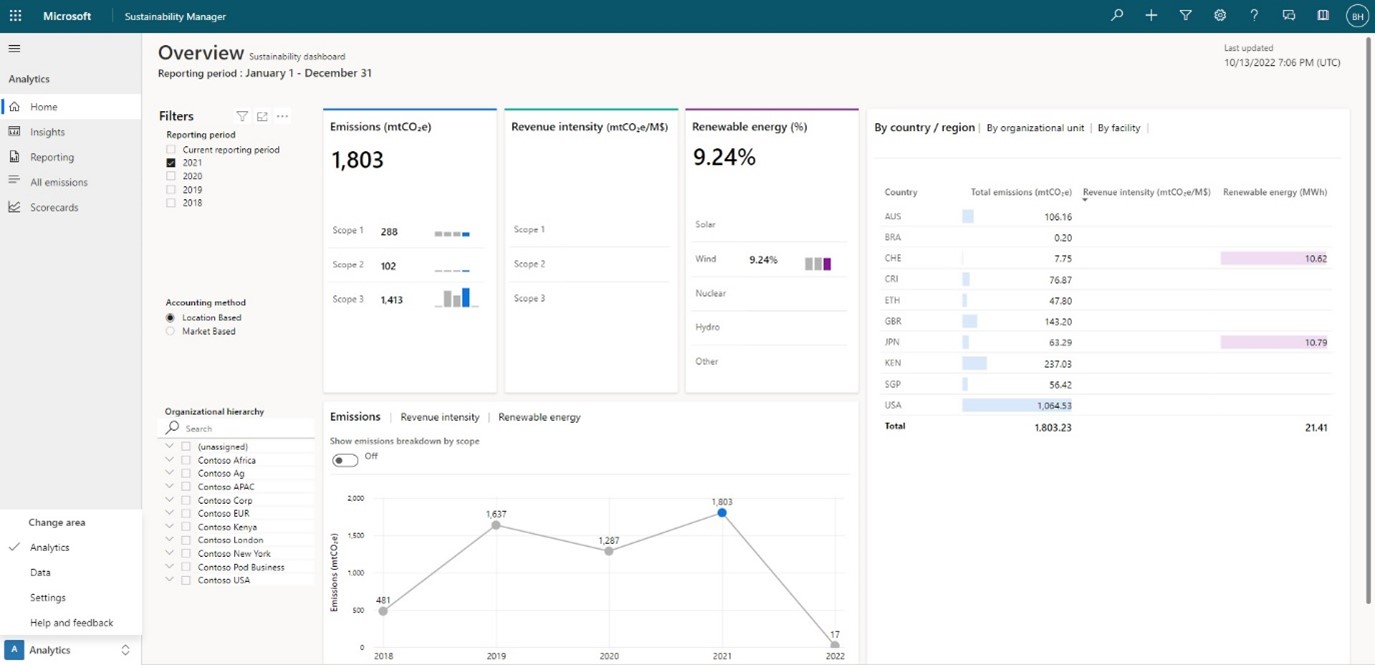
Figure 1: The landing page provides a general view of all emissions
Tailor the platform to your organization
This article will explain how to configure the platform from start to finish. The dashboards on the home page are the end result of all configurations, so before diving deeper into analytics, we must start at the Settings page.
At first, we configure the organizational structure or hierarchy, facilities and reporting periods of your organization on the Company profile tab. Optionally it is possible to map out regions with multiple countries at the Region mapping tab.
Next up is the Reference data tab (see figure 2). This tab provides a collection of categories that the platform uses for internal referencing to calculate emissions for specific activities. For example, if your organization uses airplanes for business travel purposes, the value ‘airplane’ should be added to ‘Business travel types’. A second example is if a construction company wants to calculate emissions from concrete waste, a ‘concrete’ type should be added to the category ‘Materials’.
Some of the reference categories are synced to other configuration tabs in the platform. For example, adding a facility to the Company profile tab will automatically add this facility to the ‘Facilities’ category in the Reference data tab. The same goes for the reference categories ‘Emission factors’, ‘Facility types’, ‘Facility usage details’, ‘Factor mappings’, ‘Organizational hierarchies’, ‘Organizational unit revenue’ and ‘Organizational units’. All other reference categories are not linked to another internal configuration page.
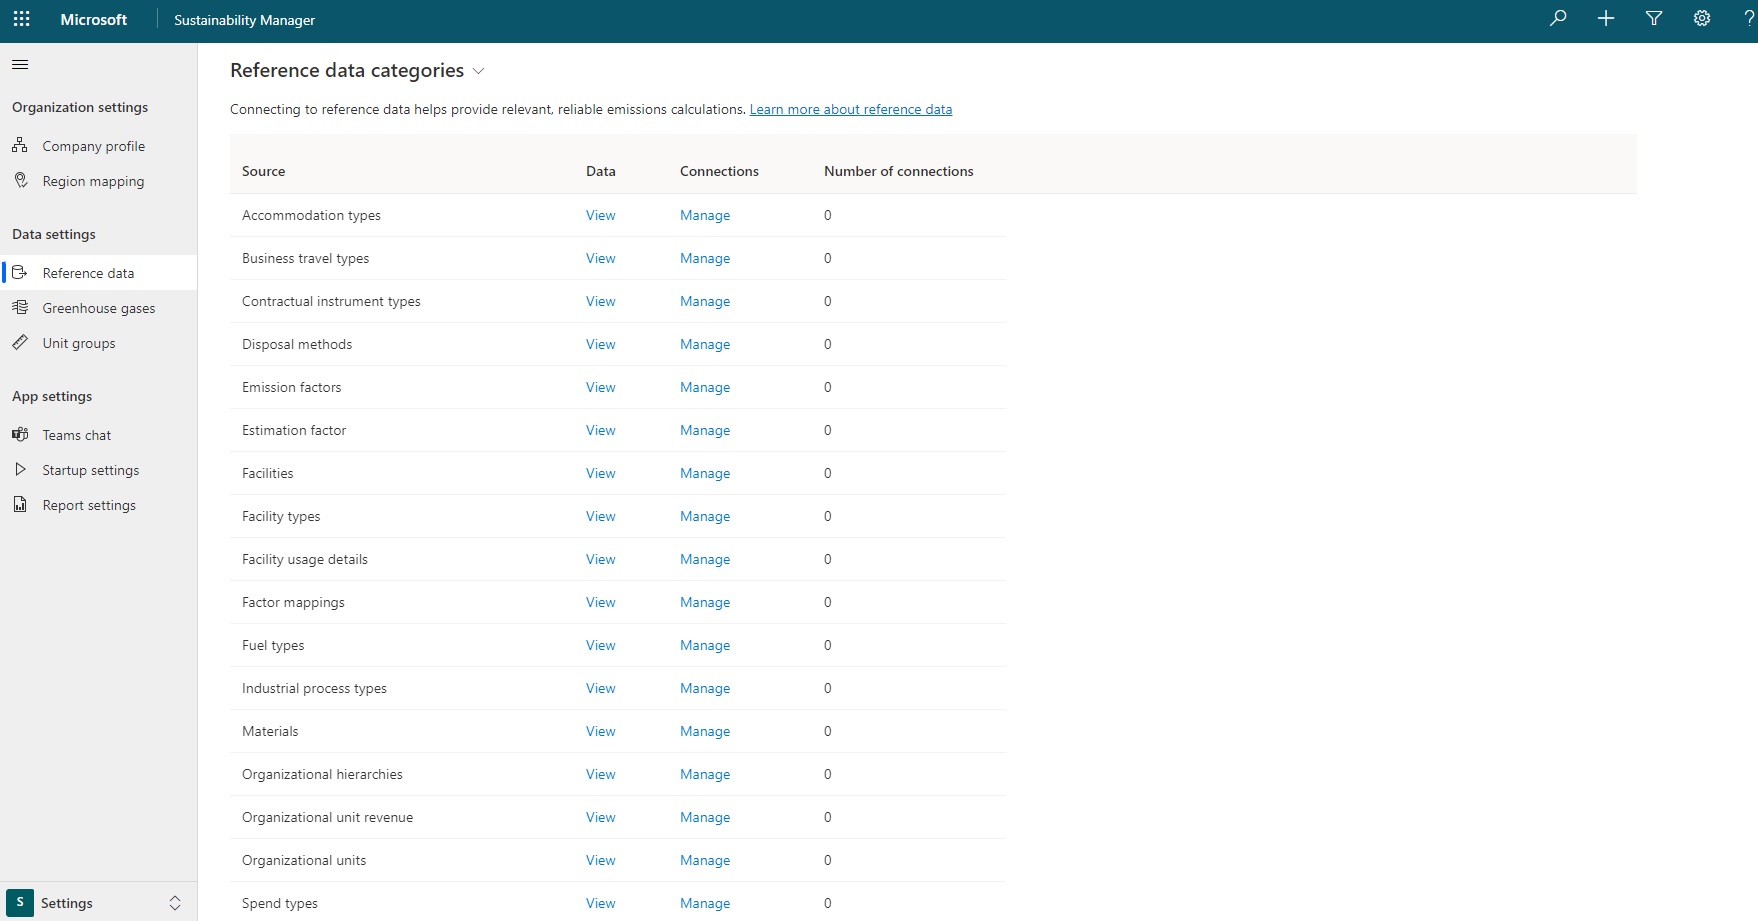
Figure 2: Add referential data that applies to your organization
A powerful feature is the ability to add referential data through a data connection (see figure 2 and 4) for each category. This feature comes in handy when dealing with large amounts of referential data which need to be kept up-to-date automatically. For example, for some sectors the category ‘Value chain partners’ can contain many active partners which are subject to change regularly. There are many connectors available so it is easy to connect to a multitude of external data sources.
Finally there is a Greenhouse gases tab and a Unit groups tab which both contain pre-populated lists. Both lists are being used for conversion purposes. For example, the global warming potential factor in the greenhouse gases list is used to translate any greenhouse gas emission to carbon dioxide equivalent (CO2e). Unlike the reference data, you can only adjust these lists manually or by importing an Excel file.
Business activities
Once the organizational structure and referential data are set up, it is time to dive deeper into adding activities to Microsoft Sustainability Manager. This is done at the Activity data tab on the Data page. All activities of our organization that generate greenhouse gas emissions are added here.
It contains fixed subcategories for scope 1, 2 and 3 emissions that the platform refers to as ‘Source types’ (see figure 3a). Relevant business activities can be added to each source type.
For example, one activity in ‘Mobile combustion’ can state the total driven kilometers of a car fleet, linked to a specific facility, a specific vehicle and fuel type, between two given dates (see figure 3b). Notice how ‘Vehicle type’, ‘Fuel type’ and ‘Facility’ are referential data categories which can be adjusted at the Reference data tab on the Settings page. Every source type will utilize relevant referential data categories.
Finally, every source type can have data connections to external sources (see figure 4). Manual adjustment is also still possible, alongside import- and export capabilities with Microsoft Excel. This allows us to tailor the data ingestion for each source type. Also, these connections are key in dealing with large amounts of activity data and integrating the platform into existing IT infrastructure.
They allow Microsoft Sustainability Manager to be integrated into an (existing) modern data platform, where the modern data platform acts as an intermediary layer between Microsoft Sustainability Manager and the various sources of data coming from your organization. An interesting side note is that Power Automate workflows are also integrated into this platform, providing extra automation capabilities.
Managing the active data connections can be done at the Data connections tab. Here it is also possible to add new data connections for activity data, reference data or pre-calculated emissions data (see figure 4). This is the same data connection form which is accessed from the Reference data tab on the Settings page or the Activity data tab on the Data page.
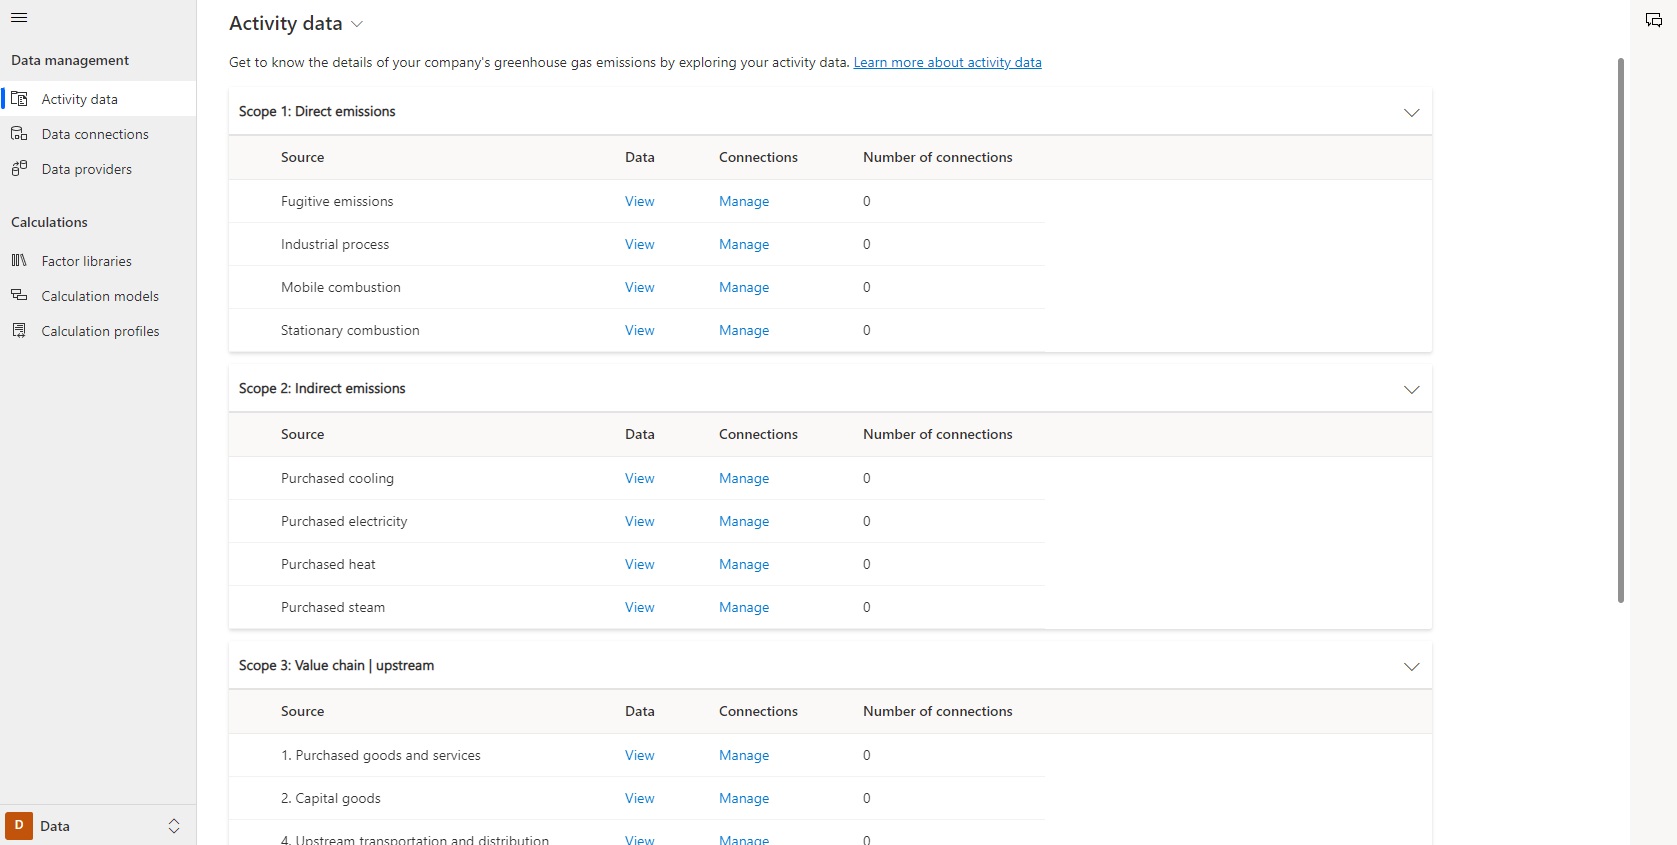
Figure 3a: The platform provides a fixed set of source types for each scope
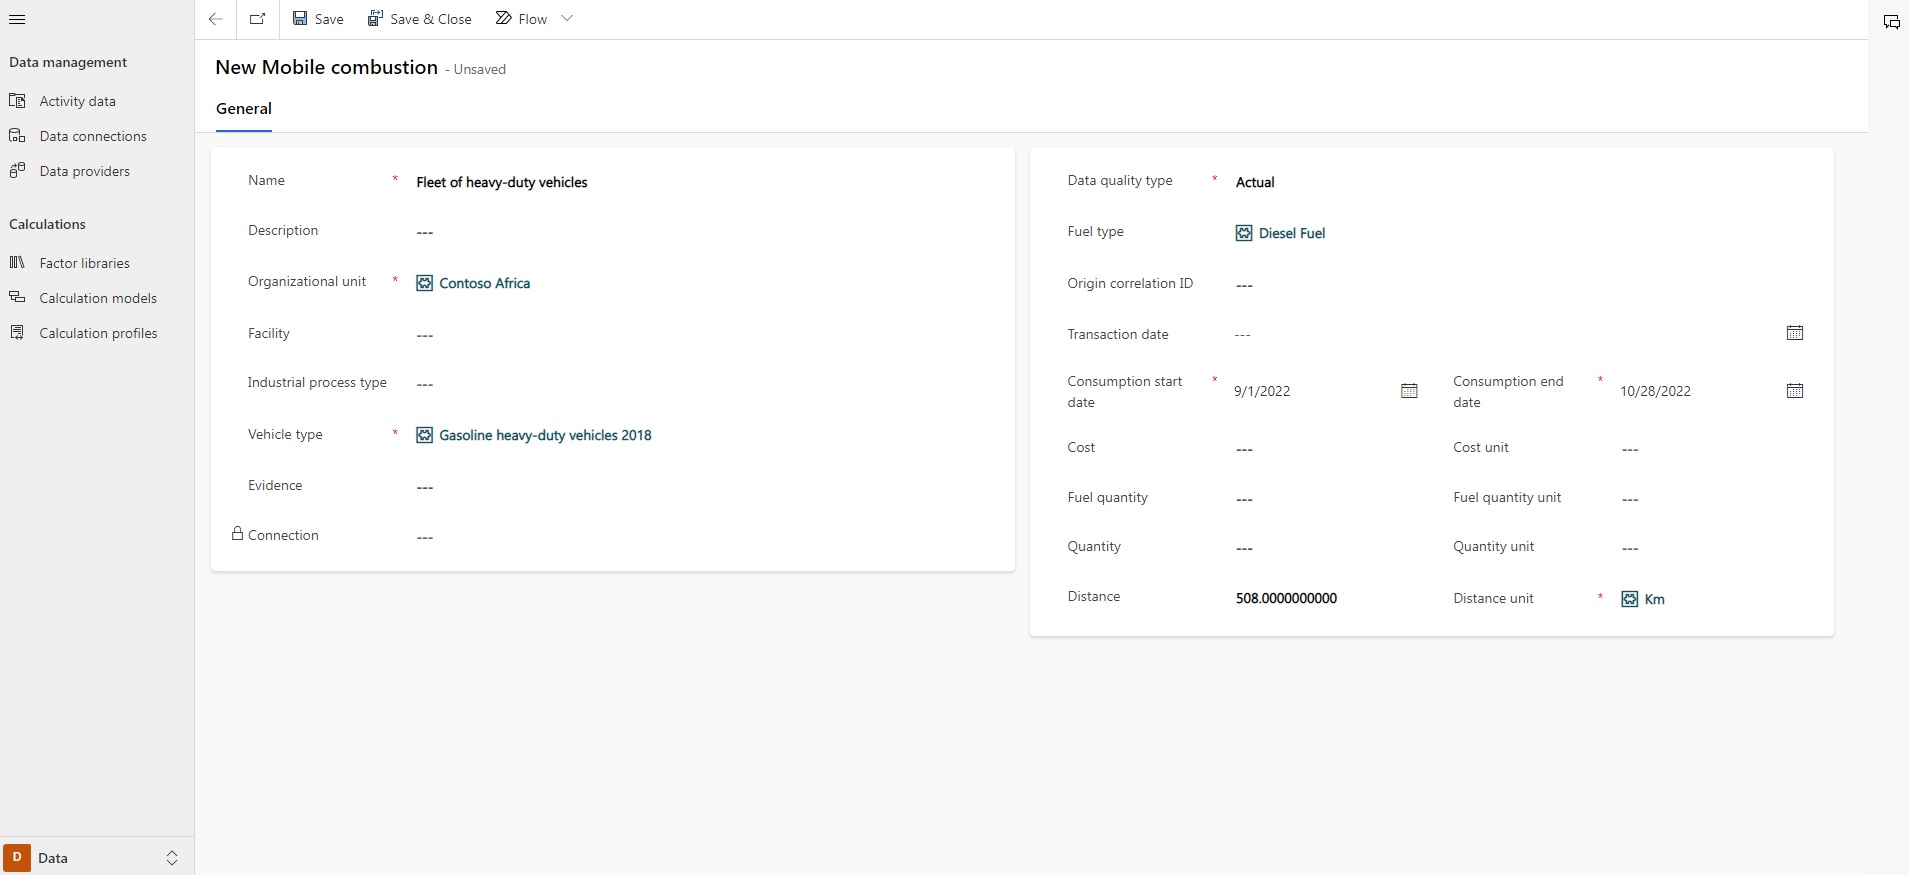
Figure 3b: Manually add activities to the mobile combustion source type
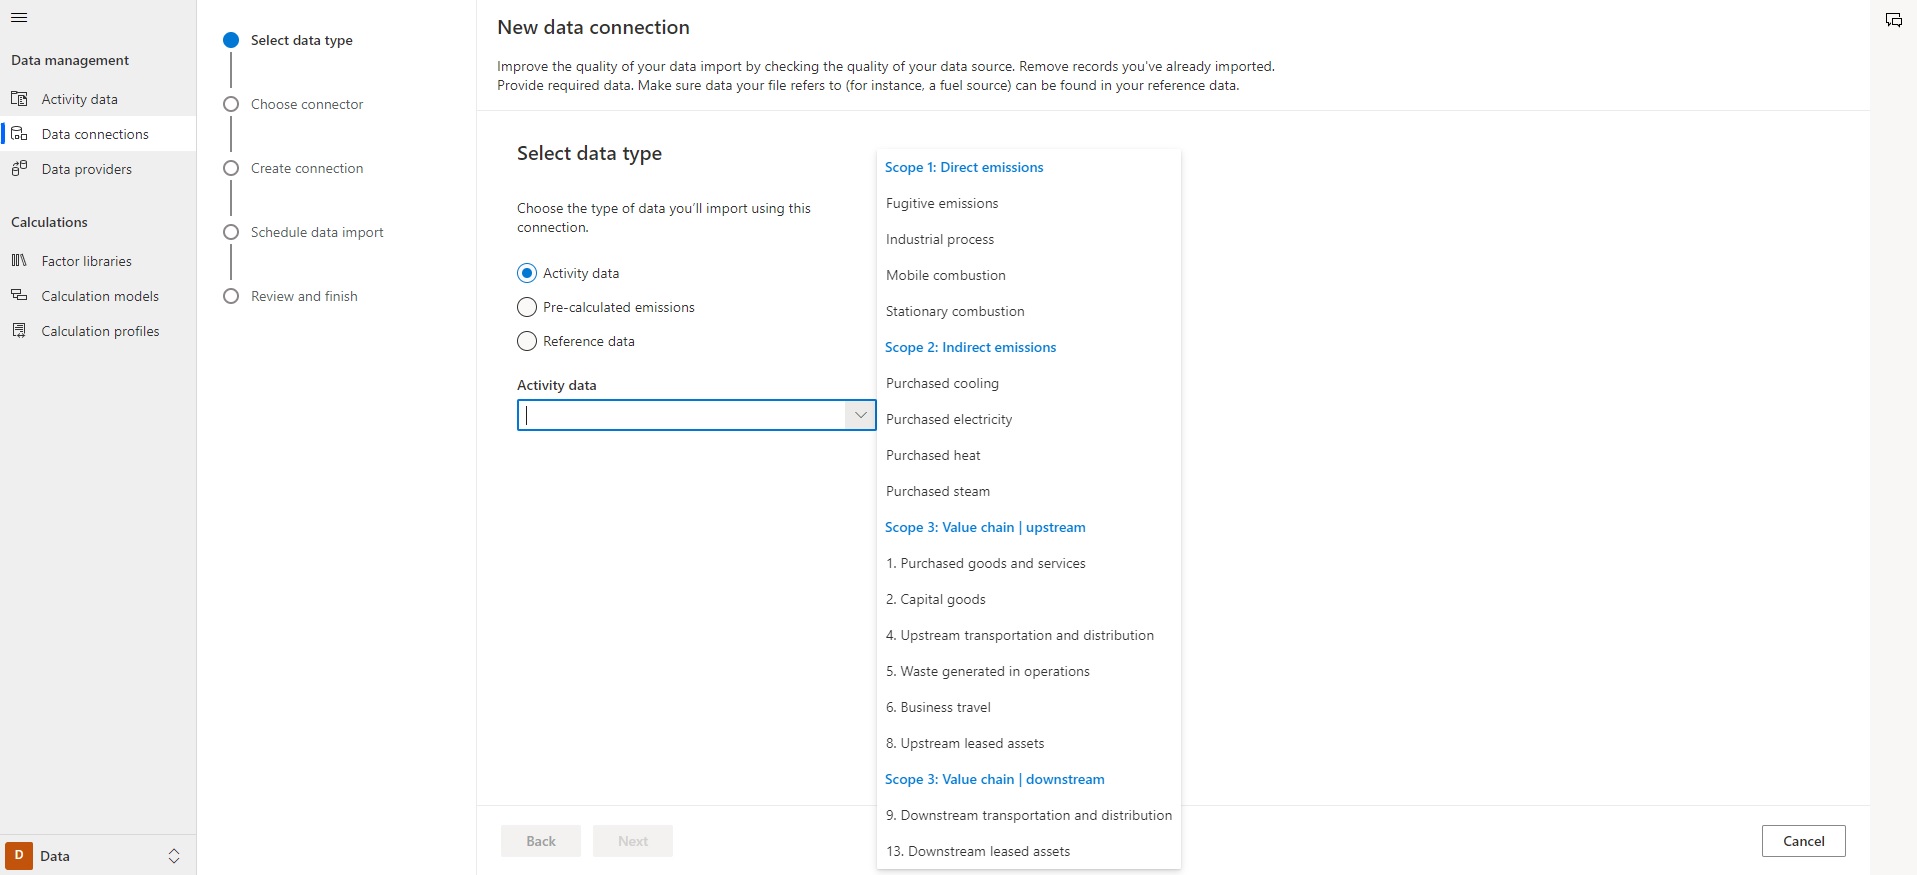
Figure 4: Connect to external data
Transforming data to greenhouse gas emissions
The next challenge after adding activities is computing greenhouse gas emissions from this data. An indispensable ingredient that is often required is emission factors, which can be configured at the Factor libraries tab. This tab subsequently contains two important elements which can be accessed on the horizontal top bar: emission factors and factor mappings (see figure 5).
Emission factors are values that are used to transform a specific measure into an equivalent amount of greenhouse gas. Often these factors are the result of scientific tests or studies. For example, the US Environmental Protection Agency states in 2021 that a gallon of diesel fuel in the US equates to 10,21 kilograms of CO2. This factor can for instance be used to compute CO2 emissions from diesel consumption data.
Within Microsoft Sustainability Manager these factors are grouped within libraries, so they can be managed thematically. There is also a distinction between factors and estimations. As the name suggests, estimation factors don’t provide the same level of evidence compared to an emission factor. For example, an estimation factor could approximate the CO2e emissions of a one-night stay at a hotel.
It is possible to automatically populate libraries with emission factors from external sources at the Reference data tab on the Settings page. This is an interesting feature for a few reasons. First, depending on the company sector and activities, there can be many emissions factors that are required to compute specific activities. Also, an emission factor for a specific activity can change over time. So historical changes can be controlled from an external data source.
As the term Factor mappings suggest, you can map out specific emission factors to relevant referential data. So you don’t have to create multiple emission factors for the same measure. For example, if we have an electricity use emission factor for different countries, we can map the facilities of our organization to the correct electricity emission factor based on their location. So multiple facilities can use the same factor if they are in the same country. Later on, if we add company activities regarding electricity use at those facilities, the underlying calculation model will recognize which emission factor to use.

Figure 5: Add and modify emission factor libraries of your choice
Once we have set up our emission factors and mappings, it is time to start configuring the calculations at the Calculation models tab (see figure 6). This is where the activity data source types are tied to emission factors or optionally their referential data mappings. It is also possible to hard-code custom formulas that act as emission factors or adjust the output of an existing emission factor. Additionally, you can use conditional statements or calculate data that is already expressed as a quantity of greenhouse gas. You can configure multiple calculation models for a specific source type of activity data.
Last but not least, the Calculation profiles tab ties the calculation model(s) to each source type. Each profile represents a calculation job that can be run manually or triggered when the underlying source data is altered. There is a limit of 50 000 records processed for each calculation profile, so it might be necessary to configure multiple profiles for source types with large amounts of data. Each calculation profile can filter the source type data so that the calculation model(s) are applied to a specific portion of the data.
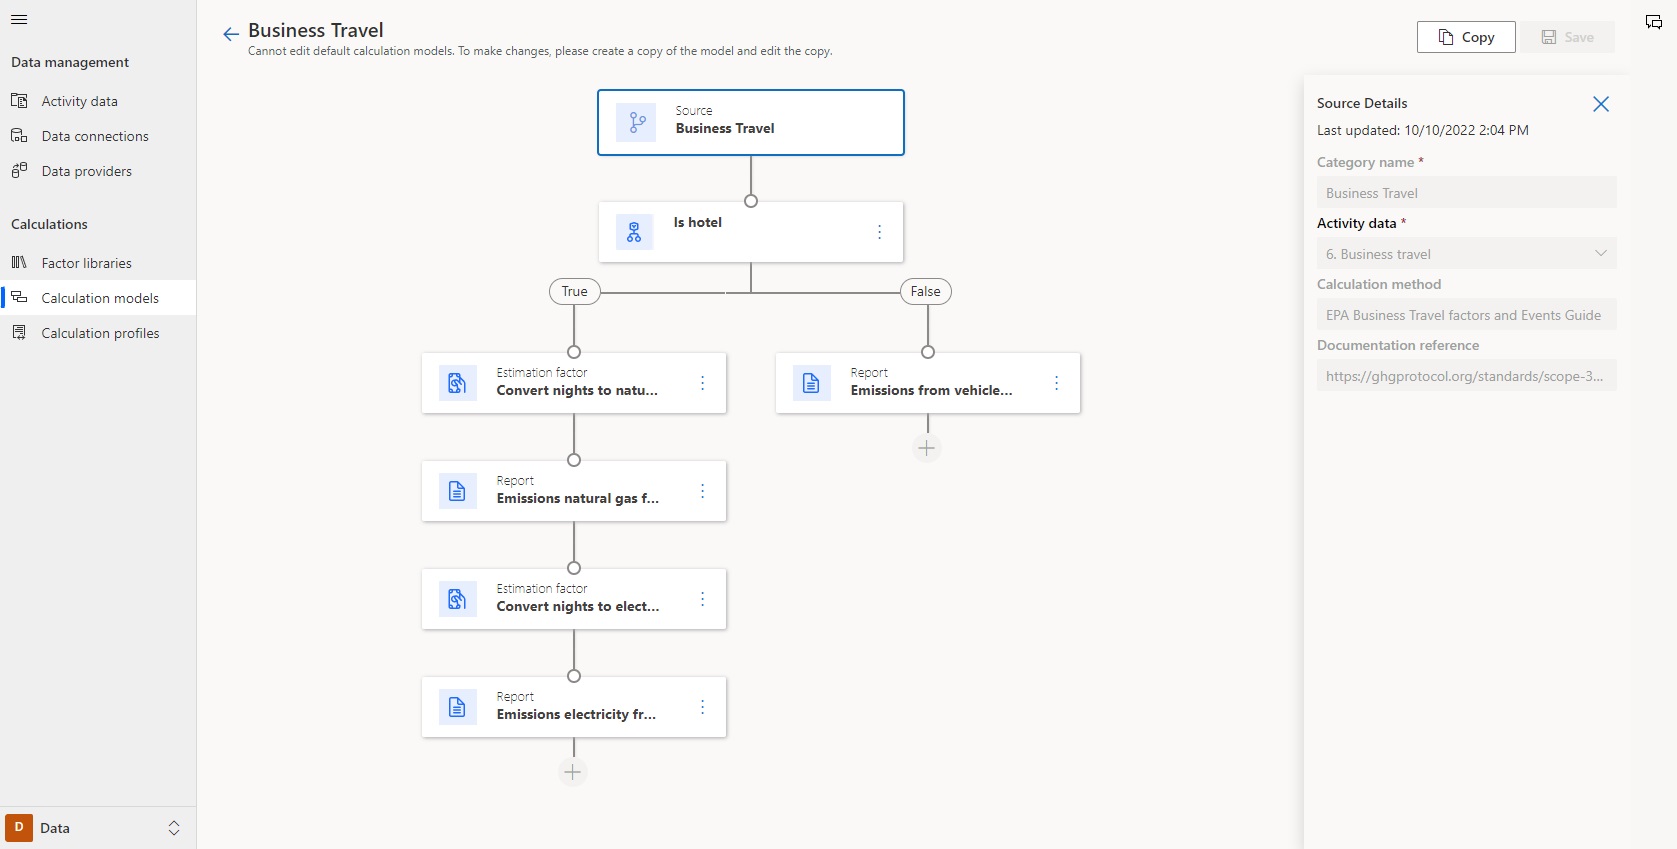
Figure 6: Configure the GHG calculation of each business activity
A closer look at emissions
At this point, all referential data, activities, calculations and profiles have been configured and subsequently transformed to CO2e measure. Now it is time to start analyzing the output data. The Analytics page is where all generated intelligence is consumed at the end of the calculation process. This page provides several tabs with the usage of renewable energy and dashboards containing detailed insights on greenhouse gases as emitted by the organization, and this for all scopes.
At the beginning of this article, we landed at the Home page tab (see figure 1) which provides a dashboard overview of the total emissions, revenue intensity and renewable energy. These variables can be filtered by reporting period, the organizational hierarchy, country or region and market- or location-based accounting method.
The Insights tab provides multiple dashboards with more detail compared to the Home page. All dashboards can be selected at the bar on top of the page above the title (see figure 7). The ‘emissions overview dashboard’ is similar to the dashboard on the homepage tab, but also shows the total emissions over the different source types. In addition, the scope 1, 2 and 3 dashboards provide similar graphs as the emissions overview dashboard, but narrows the emissions down to each scope for more detailed analysis.
For instance, they allow monthly comparisons comparing the different reporting periods for the total emissions of that scope (see figure 8). Renewable energy use can separately be visualized with the Renewable energy dashboard. And last but not least the Deep analysis dashboard allows a decomposition tree view of the total emissions (see figure 7).
The analytics page also provides tools that can be used for reporting purposes. It is possible to generate (Excel or Word) reports of all calculated emissions or activity data on the Reports tab. The platform can optionally tag this data with variables such as market-based or location-based, facility or region and so on. This feature also comes in handy for making back-ups, auditing purposes or quality management systems such as ISO 14064. Additionally, the All emissions tab can be used for similar purposes. This tab provides a complete list of the actual output of all calculations. Also, pre-calculated emissions data are added to this list manually or through a data connection from the Data connections tab on the Data page.
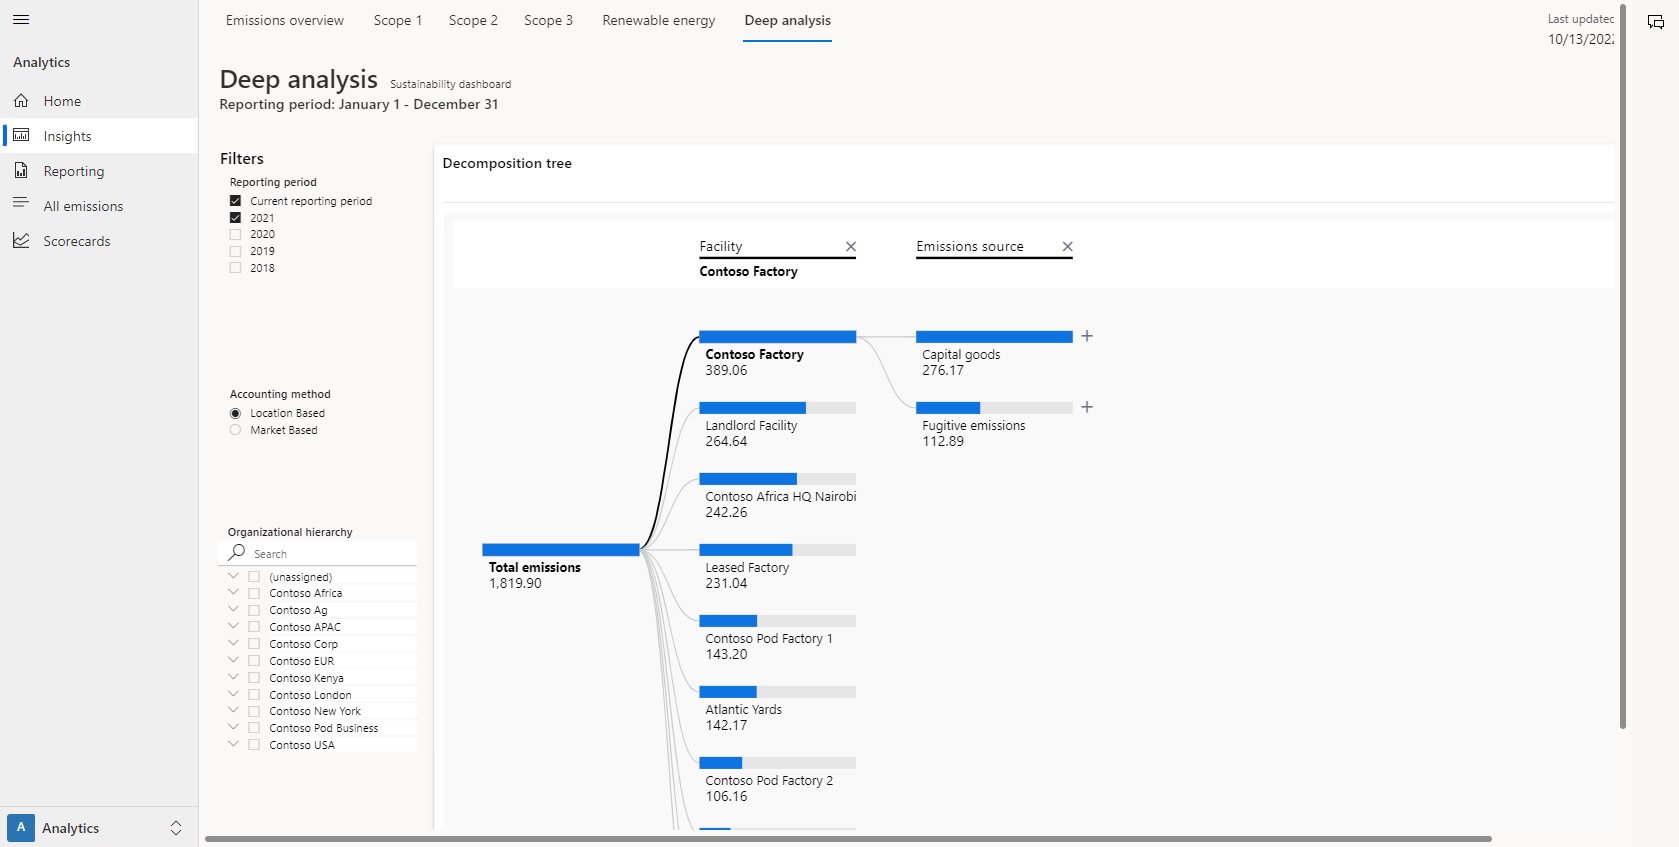
Figure 7: Drill down to specific variables to get a closer look
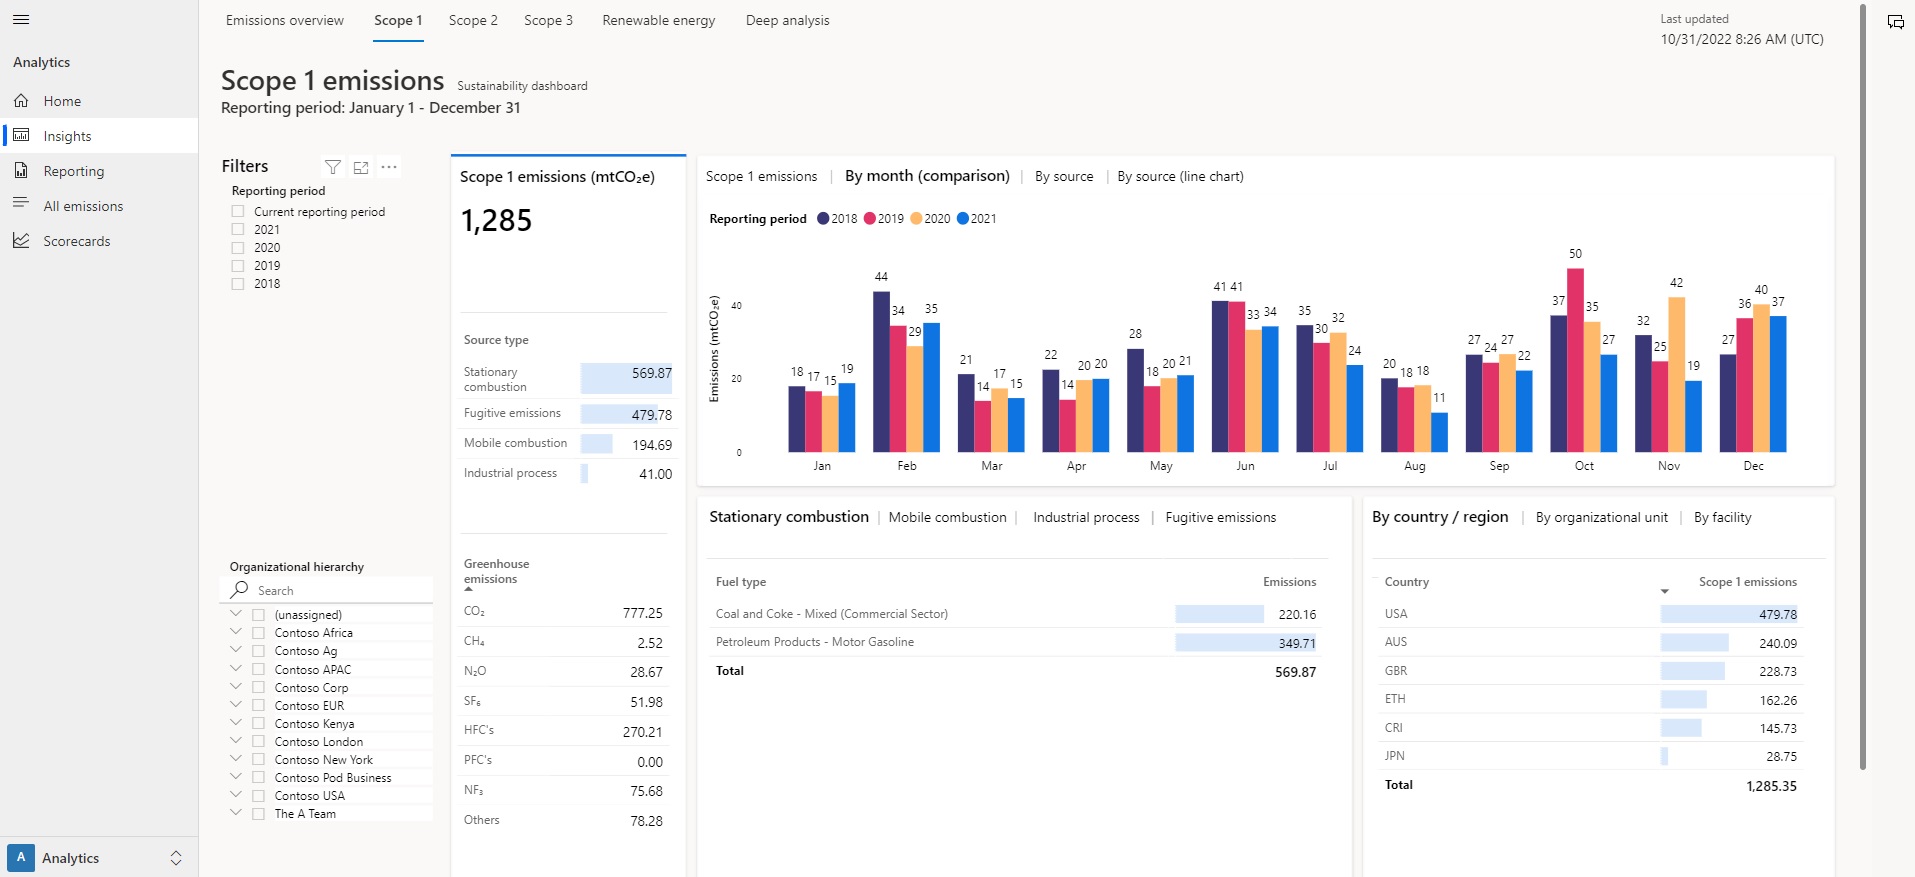
Figure 8: Get detailed information on each scope
Time for action
After analyzing and reporting on the CO2e emissions of our organization it is time to take action. We can now use our newly acquired analytic insights to set ambitious goals, which are key in mitigating climate change. Microsoft Sustainability Manager allows you to set emission goals which can be tied to specific organizational units or facilities at the Scorecards tab on the Analytics page.
A scorecard is a collection of similar goals. Each goal can subsequently contain different subgoals. For example, we can create a scorecard “Energy mix contains 100% renewables by 2030”. In this scorecard, we could configure a parent goal such as “Renewable energy projects” with subgoals for every facility of the organization.
The Scorecards tab provides two views which are selectable on top of the page: scorecards or goals.
Selecting ‘goals’ shows a list of all (sub)goals and their statuses, which are not grouped by scorecard. This view comes in handy for easily tracking the statuses of all goals. It is also possible to view this list hierarchically so that all goals are grouped by their parent goal (see figure 8). The scorecards’ view on the other hand shows all scorecards that are active with the totals of each status value that are being met by the goals of that scorecard.
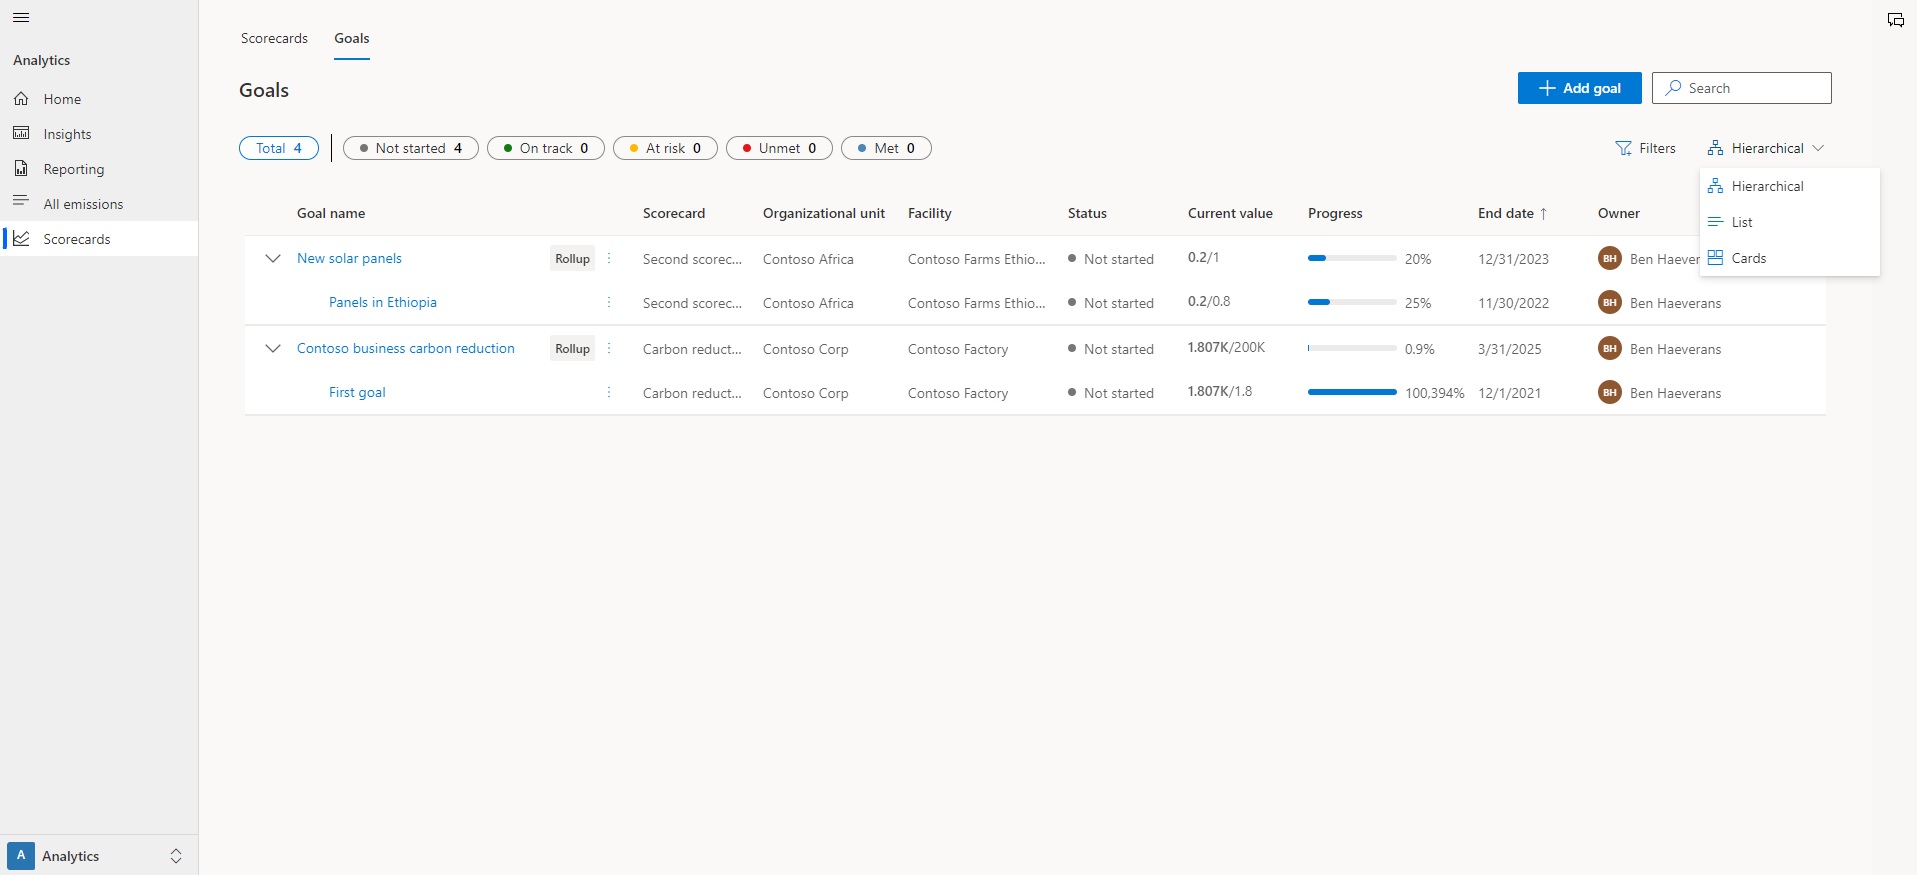
Figure 9: Track the impact of your CO2 reduction plans
The actuals and targets for each (sub) goal can be inputted manually with check-ins under the history screen (see figure 9). Additionally, these data points can be retrieved automatically from internally calculated data. And last but not least, parent goals can obtain actuals automatically as the sum of the actuals of their underlying subgoals by selecting “Roll up” as a data source for actual values. Additionally, each goal contains a status field. This can be set manually or automatically via configured status rules which update the rule accordingly.
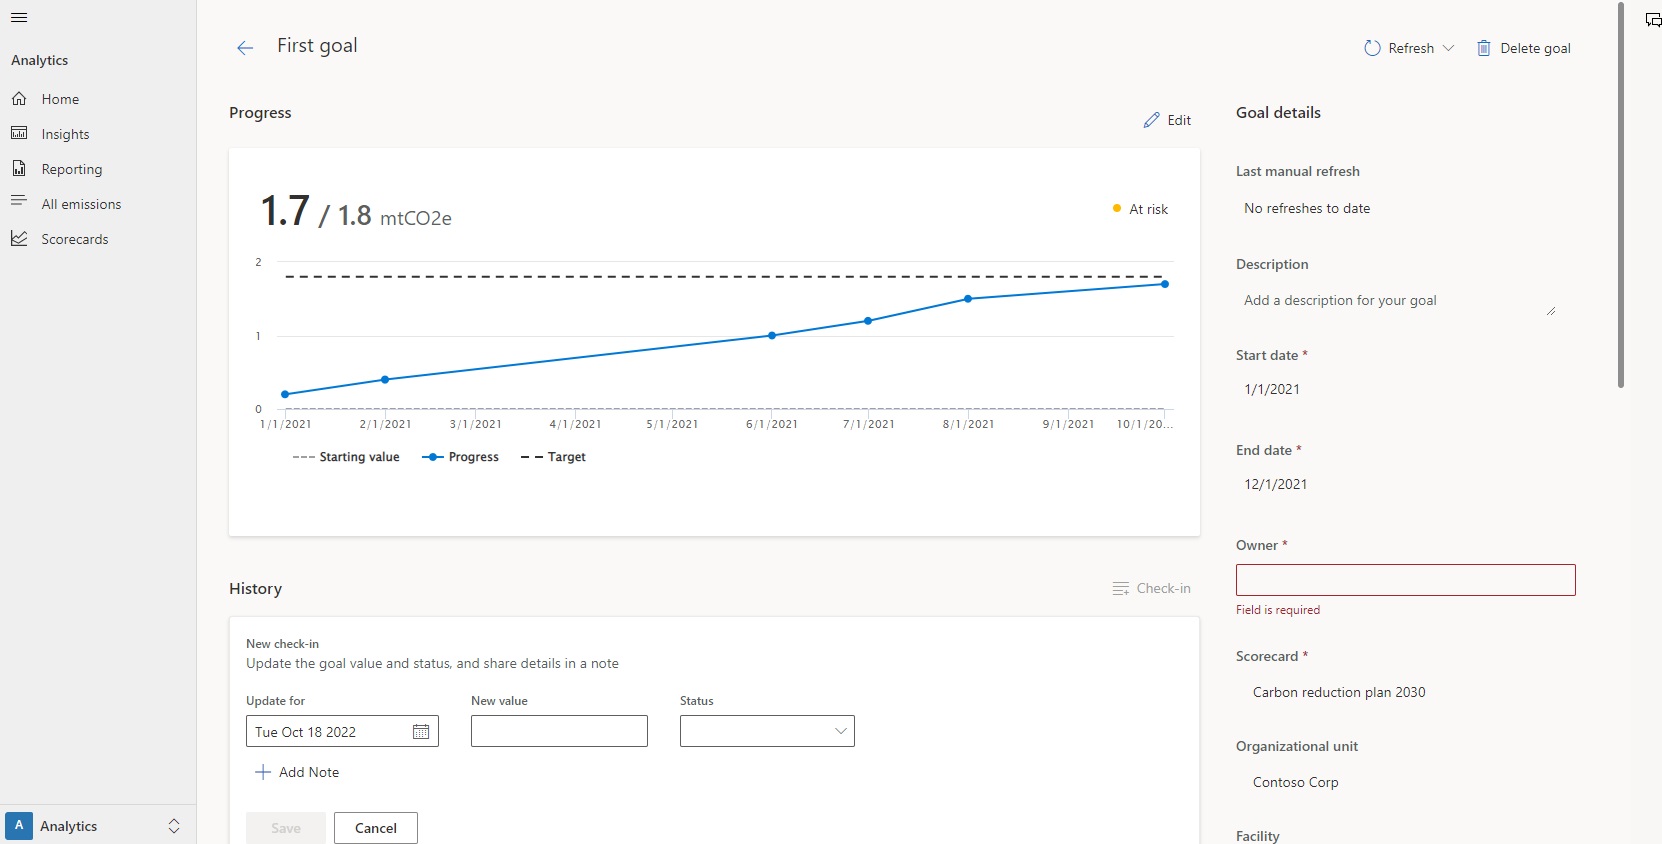
Figure 10: Detailed and auditable input for each goal
Cooperation is key
As it turns out, calculating CO2e emissions, turning data into insights, turning insights into action plans and reporting the whole process is not a simple feat. It requires many people to cooperate with one another. Microsoft Sustainability Manager facilitates this collaboration by offering integration in Microsoft Teams. It can invigorate the involvement of different colleagues by setting up different Teams channels where records can be pinned and discussed. Alternatively, it is possible to chat directly from inside the platform. From the teal-colored top bar select the Collaboration button to bring up the right pane (see figure 10).
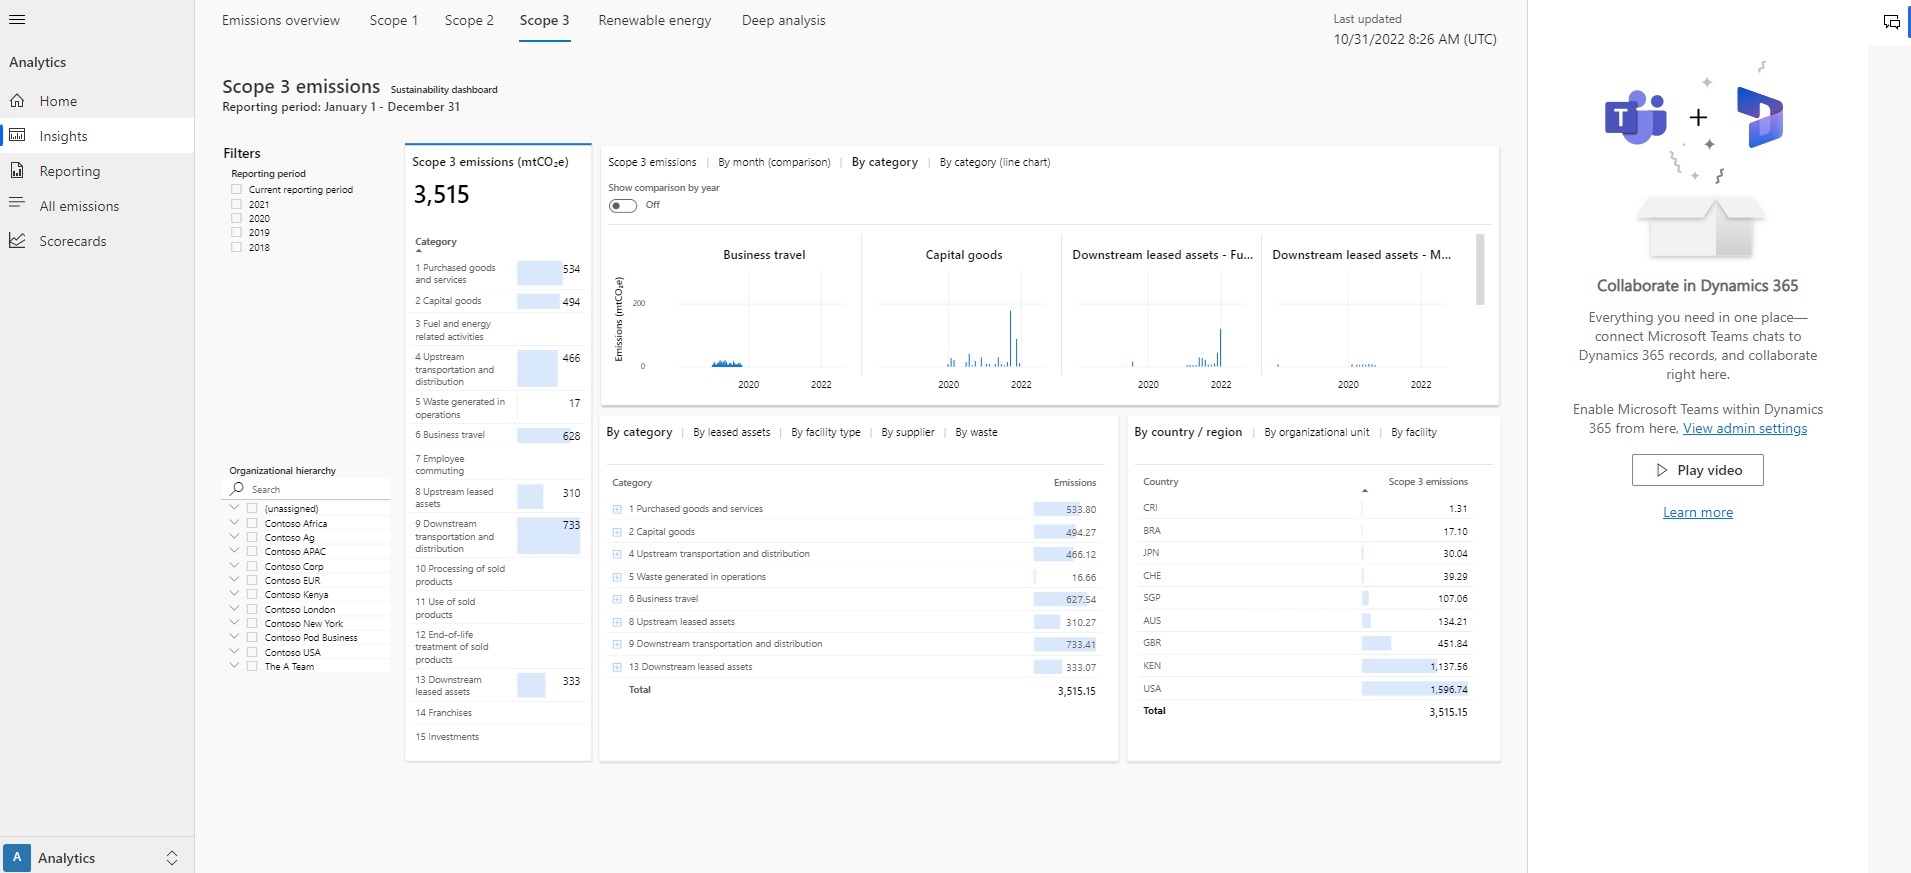
Figure 11: Microsoft Teams integration
Getting started
Microsoft Sustainability Manager is a well-thought-out platform that can form an excellent basis for climate reporting under ESG frameworks, CO2 monitoring or reduction plans and carbon accounting for quality management systems. On top of that, the platform can be tailored to any organization and can be fully integrated with existing IT infrastructure.
We conclude this article with the pros and cons of Microsoft Sustainability Manager:
| + Predefined calculation methodology | - Limited to greenhouse gas-related measures |
| + Connectivity with external data sources | - No customizable dashboards |
| + Scorecards and goals | - No integrated action plans or project management |
| + Mobile Accessibility | - No straight reporting to specific ESG framework standards |
| + Collaboration capabilities with MS Teams | |
| + Report generation of output data |
This insight was initially published in December 2022.
Below we provide an update on the most important new functionalities added since.
New features in 2023
Since June 2023, Microsoft has unveiled a series of exciting new features that are currently available in preview mode. These enhancements mark a significant leap forward in expanding the Environmental, Social, and Governance (ESG) capabilities of the Sustainability Manager, shedding light on Microsoft's long-term vision for ESG reporting.
One of the primary limitations faced by the Sustainability Manager has been its focus on greenhouse gas-related data. In response to this, Microsoft has taken steps to broaden the ESG reporting scope by introducing water and waste data models. These additions empower users to leverage the platform for monitoring and reporting not only on greenhouse gas-related ESG KPIs but also on water and waste-related metrics, encompassing factors such as quantity and quality (sampling) data.
To facilitate this expansion, dedicated water and waste dashboards have been incorporated into the analytics pane. Additionally, the data pane has been enriched with new pages specifically designed for connecting data sources to these newly introduced data models. Subsequently, the calculation models and profiles have been updated to integrate water and waste data. This includes enhancements to the factor libraries page and the reference data page under the settings tab, enabling users to perform and visualize calculations on water and waste data in a comparable manner as the greenhouse gas calculations.
Another substantial update involves the introduction of survey capabilities. Users can now send surveys to value chain participants and harness EcoVadis data to calculate scope 3 emissions. This survey functionality is integrated into Sustainability Manager, and it necessitates the use of a Power Pages site that is automatically generated within the platform. Users can create and distribute surveys to their value chain partners directly from this site. To enable this feature, value chain accounts must be added through the 'Value chain data' page on the Data pane, and EcoVadis data can be incorporated via the Data Providers page on the Data tab. Moreover, the Calculation models page has been enhanced to accommodate the integration of value chain partner revenue data, enabling the conversion of expenditure data to CO2e. It is important to note that access to EcoVadis is a prerequisite for utilizing this feature.
Last but certainly not least is the introduction of Project ESG Lake. This solution offers standardized data models covering various ESG dimensions, including carbon, water, waste, social, governance, biodiversity, and general business areas. It provides users with a comprehensive framework for managing their ESG data estate, comprising data models and accompanying pipelines or notebooks. This framework is designed to be seamlessly utilized within the Azure ecosystem, including services such as Synapse or Databricks. Furthermore, Project ESG Lake includes Power BI reporting templates aligned with the data models and the Corporate Sustainability Reporting Directive (CSRD), streamlining the reporting process and ensuring compliance.
A particularly noteworthy aspect of Project ESG Lake is the integration into Microsoft Fabric, currently available in preview. This integration empowers businesses to deploy an ESG Lake within their Fabric solution. Essentially, this Lakehouse contains more than 400 tables spread across the various ESG data models, providing a rich predefined repository of ESG data. This integration unlocks the full potential of Fabric, establishing a unified ESG reporting data platform within a single solution. Importantly, it also includes connectivity with Sustainability Manager, enabling a seamless flow of data and insights between the two systems. Want to know more about Microsoft Fabric? Follow this link.
Would you like to find out what Microsoft Sustainability Manager can offer for your organization? For more information, get in touch with element61 here.


