Introduction
TimeXtender is a tool that allows to design and develop a data warehouse / modern data platform in a faster way, without having to deep dive into the technical code.
TimeXtender also allows you to develop and generate a semantic model (SSAS Tabular Model, Qlik or Tableau) based on the DWH that has been developed in the same tool.
In this insight, We will explain why it could be a good idea to develop the Tabular Model inside TimeXtender, rather than developing it the classic way in Visual Studio.
When developing a Tabular Model in TimeXtender, there are also a few things that remain tricky, especially coding the custom measures in DAX. Because the error messages from TimeXtender are not always that helpful, it is important to know exactly which syntax TimeXtender expects. Therefore, special attention is given to this subject so that you get a quick start on that learning curve.
Why use TimeXtender to develop your SSAS Tabular Model
If you use TimeXtender to develop your company’s data warehouse / modern data platform, and you want to develop a Tabular Model on top of that data warehouse, then it is a good idea to also use TimeXtender to develop this Tabular Model.
When developing a data warehouse in TimeXtender, it not only generates all the necessary tables, views and all the ETL code to fill those tables, but it also stores all the metadata about those objects in its repository.
Because all the metadata of the tables, views, and columns is already available in TimeXtender, it is a simple drag-and-drop operation to add a table or view to the tabular model.
One could argue that this is similar when developing a Tabular Model in a classic way, i.e. via Visual Studio. In this tool, when you start the development of the model, after you connect to the data warehouse database, you can simply select the tables/views to import.
The biggest advantage of developing it in TimeXtender is that it is much easier to maintain the Tabular Model.
In the ideal world, the Tabular Model development is started after the data warehouse development is finished and final. But in the real world, columns are added, removed, renamed or data types change, even after the table or view has been used in a Tabular Model.
In TimeXtender, the Tabular Model columns remain linked to the metadata of the data warehouse.
This improves a lot the ease of maintenance.
In addition, the linked metadata allows for full data lineage. This makes it possible to analyze the origin of a tabular model field to the data warehouse columns and even further all the way to the sources of the data warehouse.
Different steps when developing a Tabular Model in TimeXtender
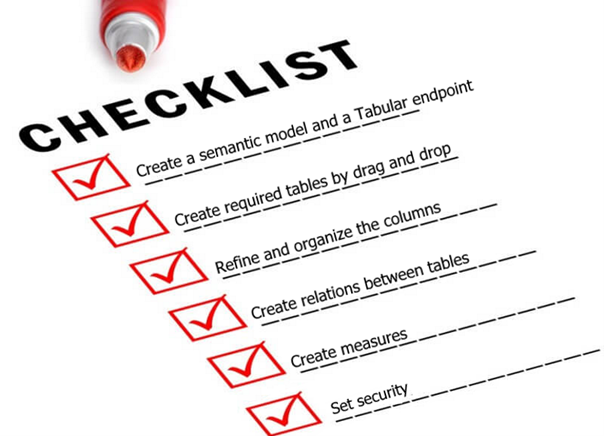
Create a semantic model and a Tabular Model endpoint
First, you will need to create a semantic model object in TimeXtender. A semantic model in TimeXtender is a logical model that can serve as the base for creating different types of physical models, which are called endpoints:
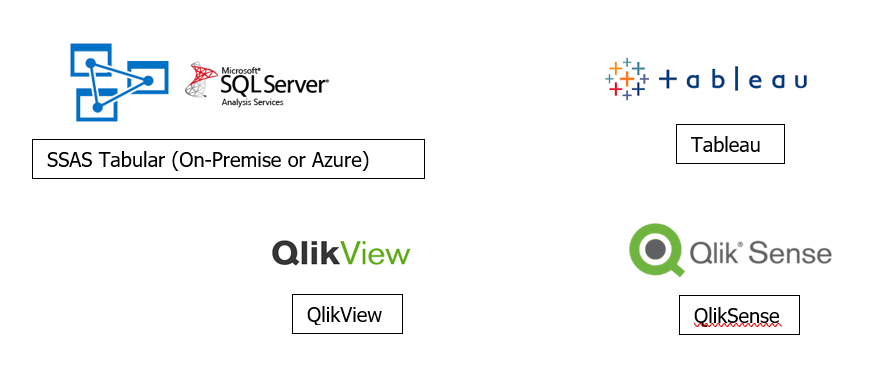
So, in theory, you could create different physical models, for different technologies, based on one logical model. This is nice, but in reality, it is not common that different user groups in an organization use different technologies, but need exactly the same data in their model.
If you would want to base multiple endpoints on one semantic model, using different technologies, do realize that there might be some parts that will need to be defined separately for the different technologies, typically the definition of the measures. TimeXtender has foreseen the possibility to do this, but it adds additional complexity. If the user requirements for the two physical models might evolve in different directions, it might be better to create two separate semantic models, one for each technology.
When creating the semantic layer, you need to give it a name, and also specify which type of endpoints are allowed for this model. If you plan to use only one type of endpoint, i.e. SSAS Tabular Model, it is better to indicate that here, because it will ensure that settings that are only applicable to one of the other technologies are hidden for this semantic model.
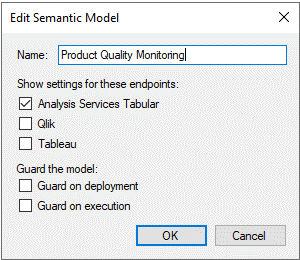
Note that this document focuses on SSAS Tabular Model as endpoint. Although many of the things explained also apply to the other types of endpoints, some are specific to SSAS Tabular Model.
Once the semantic layer is created, you can consequently create the Analysis Services Tabular endpoint. Here, you define the name of the new tabular mode, and the connection parameters to the Analysis Services server, either SSAS installed on a server or Azure Analysis Services.
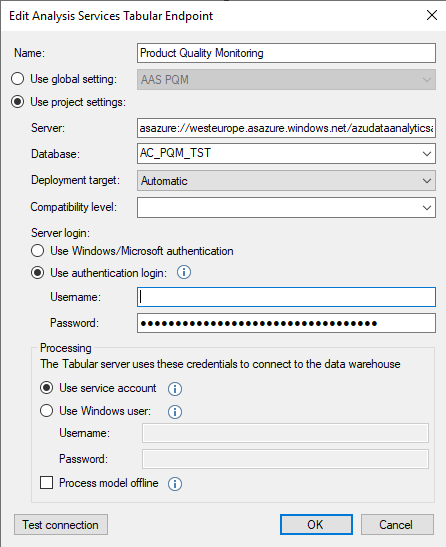
If you work with a multiple environment setup, where the different environments need to connect to different SSAS environments, you should set up the environment details in the global environment properties of TimeXtender. This will ensure that each TimeXtender environment points to the correct SSAS environment, even after a TimeXtender project has been transferred from one TimeXtender environment to another.
Create required tables by drag and drop
This is by far the easiest step.
Open the data warehouse and the semantic model in two different panes next to each other, and then simply drag and drop the required tables and views from the data warehouse to the “Tables” node inside the semantic model.
For each table or view that you drag and drop into the semantic model, TimeXtender will by default set the names to the name of the table and columns of the source table or view.
In the window that pops up, you need to select which columns need to be in the semantic table. By clicking the top checkbox, you can easily select all columns.
In this window, you can also do the following
- Rename the semantic table if needed, e.g. to a more user-friendly name.
This is the name that the end user will see in the end user tools like Power BI or Excel. - Rename the semantic columns if needed, e.g. to a more user-friendly name.
This is the name that the end user will see in the end user tools like Power BI or Excel. - Put some columns on hidden.
This is typically done for the Primary key and Foreign key columns that are needed for the relations, but have as such no meaning for the end users.
It is considered good practice to also put all numeric fields that represent a measure value on hidden, and create explicit measures for these at a later stage. - Add a description to the Semantic Table.
(This will show up in the tooltip at the end user tools like Power BI)
Creating relations between tables at this stage?
If this is not the first semantic table that you add, TimeXtender will ask if you want to create relations with other tables, providing some choices to choose from based on
- Columns that have matching names in both tables/views
- Relationships that have been defined between tables in the data warehouse layer
(only if tables are used, not in the case of views)
Depending on if you base the tabular model on tables of views, and which naming standard you use for the primary key and foreign key fields in the tables or views, the proposed options will typically not include the correct option.
Therefore, it is advised to not create the relations at this stage, but to create them later in a more controlled way by mapping the correct primary key field to the correct foreign key field. See the step “Create relations between tables” later in this document.
Tables or Views
You have the choice to build the Tabular Model directly on top of the data warehouse tables, or instead to first build a set of views in the data warehouse and build the Tabular Model on top of those views.
When building a Tabular Model in a classical way, i.e. using Visual Studio, it was definitely a good idea to first built a layer of views, because it decouples the Tabular Model from the tables. If a column needs to be renamed in the table, one could use the view to still show the old column name to the Tabular Model.
When using TimeXtender, the renaming of source columns is no longer that much of a problem.
However, it is still considered good practice to have this extra layer of views on top of the data warehouse tables, and let all subsequent layers refer to the views rather than the tables.
Make sure, when you create these views, to use parameters, and to create the mapping between the view fields and the parameters, so that the data lineage is not “broken” on the view.
Set the default Date Table
In an SSAS Tabular Model, one date table can be set as the default table.
In TimeXtender, this can simply be done by right-clicking the concerned table, and selecting “Set as Default Date Table”.
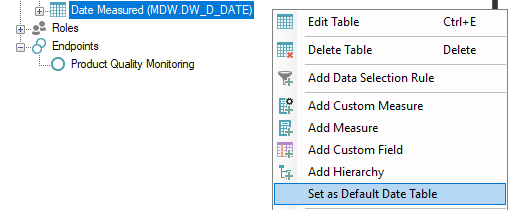
Setting a table as a date table makes it possible to use time intelligence functionality from DAX. The table that is set as the default date table will also behave slightly differently in certain DAX calculations like the CALCULATE & Time Intelligence functions
If you have multiple date tables, and you need the other date tables to behave in the same way in DAX calculations as the default date table, it is important to realize what this setting does.
When any of the filter arguments inside a DAX CALCULATE statement includes the date column of the default date table, DAX adds an ALL(‘DefaultDate’) filter behind the scenes to this statement, so removing any previous filters on this table.
Therefore, if you want to build a measure using a date table other than the default date table, and you want it to behave in the same way, you will need to add explicitly the ALL(‘OtherDate’) filter to the CALCULATE statement.
Refine and Organize the columns
After the creation of the semantic tables with their columns, you can edit columns to do the following
- Delete the field (can also be done at the time of the creation of the semantic table)
- Hide the field (can also be done at the time of the creation of the semantic table)
- Change the field name (can also be done at the time of the creation of the semantic table)
- Add a description
(This will show up in the tooltip in some end-user tools like Power BI. In other tools, or when using another type of endpoint, this only serves as an annotation for the developer.) - Optional: Specify a “Sort By” column.
For example, it would be more user-friendly to sort the field MonthName by the field MonthNumber, rather than sorting the months alphabetically. - Set the “Summarize By” for numeric columns.
It is especially important to set this property to “Do not summarize” for all numeric columns that do not represent a measured value, i.e. columns like customer number or year.
Note that the user can still override the summarization in the end user tool when using this field, but it is not convenient when the default is not set correctly, because the end users will need an extra step every time they use this field. - Optional: Data format for numeric or datetime fields.
- Optional: Data category for fields that contain geographic information to be used in map visuals, or fields that contain an image or web url.
For most fields, this property will stay on “Uncategorized”. - Optional: Add a custom field, defined by DAX code
You could e.g. denormalize a field from a higher table using the RELATED function.
But typically, this sort of denormalization will already be done in the data warehouse layer, either in the table or the view.
Therefore, it is rather rare that a custom field needs to be added to the semantic table.
On the other hand, it is very common to add measures and custom measures, these will be discussed in a later chapter.
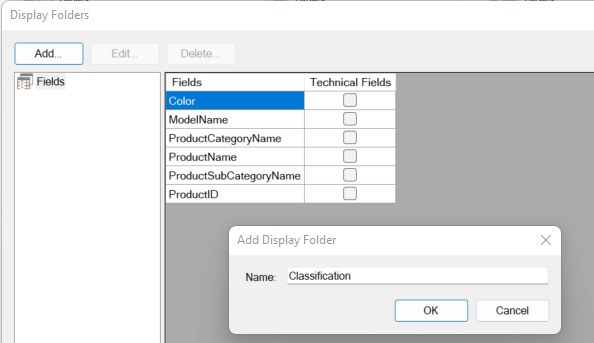
Organize the columns in Display folders (optional)
When certain semantic tables contain a lot of columns, it is good practice to organize those columns in folders (and possibly subfolders) within that table.
Right-click the table, and select “Display folders”.
In the “Display Folders” window, click the Add button to add a new display folder. Note that, if you have already created a display folder when working on another table, this display folder will show up as an existing folder on all the tables. For example, if you want to use a “Technical Fields” display folder on all your tables, you only need to create it once. After that, you just need to assign the fields to this existing folder.
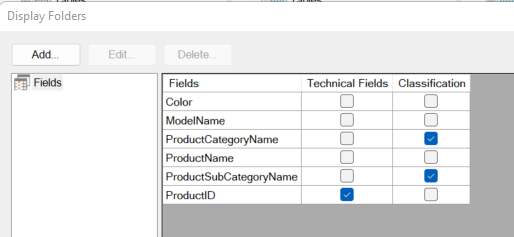
After adding the required display folders, they will show up as columns in this window. Now simply select the correct display folder for each column.
Columns for which no display folder is selected, will be displayed in the root folder of the semantic table.
Display folders that are not used for a certain table (or only for hidden columns), will not be visible in the end-user tools.
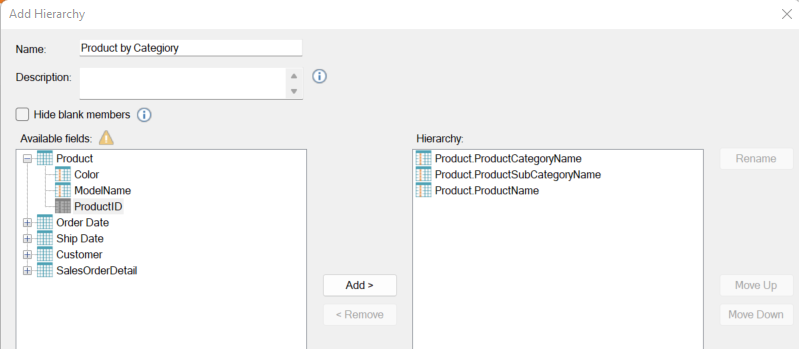
Create Hierarchies (optional)
Hierarchies can make a tabular model more user user-friendly. It provides the user with default pathways to use when drilling down his data.
Right-click the table, and select “Add Hierarchy”.
Then drag the fields from the “Available fields” pane to the “Hierarchy” pane.
Create relations between tables
In a Tabular model, the different tables need to be connected by relations.
Most of the time, relations are between dimension tables and fact tables.
In the case of a snowflake design, there will be also relations between dimensions tables.
When building a tabular model on top of a data warehouse, the columns to use for your relations should be very straightforward, i.e. connecting the Primary Key of the dimension with the corresponding Foreign Key of the fact.
To create a relation in the Tabular Model in TimeXtender, drag the primary key column of the dimension table and drop it on top of the foreign key column of the fact.
By doing it in this direction, both attributes “cardinality” and “filter direction” will default to the most logical setting, and will (almost) never need to be changed.
- Cardinality: Many to One (Many fact records for One dimension record)
Can be changed to One to One, e.g. between two dimensions that have the same level, but this is only very rarely used, because it would probably make more sense to combine the two dimensions in the data warehouse into one single dimension.
Can be changed to One to Many, but this only makes sense if you mistakenly dropped the fact FK to the dimension PK instead of the other way around - Filter direction: One direction (To the table at the many side, so to the fact table)
Can be changed to bidirectional (To both tables), but querying a tabular model with bidirectional tables can have unexpected results, so this is only advised in very specific cases
Create measures
When a user makes a report, he will combine attributes from dimensions with measure values from a fact table.
Implicit measures vs. explicit measures
Two types of measure values can be used:
- An implicit measure: A numeric field from a fact table in the model, e.g. “OrderAmount”.
The model developer can define the default Summarization in the model, the reporting user can still override this summarization in the report. - An explicit measure: A predefined measure in the model, that already contains the way it is calculated and summarized. E.g. “Total OrderAmount”.
Generally, it is considered good practice to make an explicit measure for all required measures, and hide the numeric fields in the fact table. It is a bit more work for the model developer, but it is clearer to the end-user what every measure means.
For example, it is better to have the predefined measures “Total Order Amount” and “Average Order Amount” rather than just have the field “OrderAmount”, and sometimes use it as a total and sometimes as an average.
Where to create the predefined measures
Unlike a (numeric) field, a measure is not really attached to a table. It can also be based on columns from different tables.
But a measure needs to be located in a table, because it will appear somewhere in the model.
There is no limitation to where you can create a measure, any table in the model can hold any measure.
Different approaches or best practices exist according to where to create the measures.
Some will keep it located in the fact table where it is (mostly) based on.
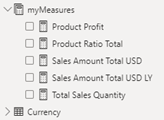 Others will create all measures in one or more dummy tables, which don’t have any visible columns in the model, so that all measures are located together.
An extra advantage of the latter approach is that all these dedicated measure tables will appear on top of the model, with a calculator symbol, designating that these are tables that only contain measures (apart from columns that are hidden). This gives the model a well-organized appearance.
How to create predefined measures in TimeXtender
There are two ways to create a predefined measure in TimeXtender.
- (Simple) measure:
- Based on a numeric field, with a chosen summarization. E.g. Total OrderAmount
- Based on a table, returning the row count. E.g. Number of Orderlines
- Custom measure:
Contains a custom DAX formula, based on one or more fields from the model.
E.g. “HighProfitabilitySales”
= CALCULATE( SUM ( SalesOrderDetail[OrderAmount) , Product[Unit Price] >= 2 * Product[Unit Cost] )
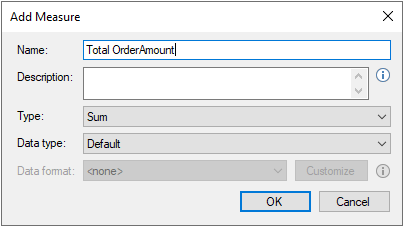
Simple measures are easy to create. Just right-click on the column or table and choose “Add Measure”, a window will appear where you need to give a name of the measure, the data type and the aggregation type.
For a custom measure, right click on the table where you want to create the measure, and choose “Add custom Measure”. Also here, you need to specify a name and a data type. But then, you need to write the DAX formula, and that is where it becomes more complex.
There are some important considerations to make when writing your DAX formula for a custom measure:
DAX measure: Make a SSAS Tabular specific expression rather than a default expression
For one measure, you can in theory write different code, depending on the Endpoint, and you can write a default formula that will be used for all endpoints for which you don’t have specified an endpoint-specific formula.
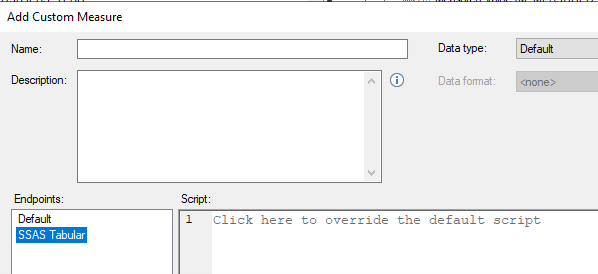
If you have only defined an SSAS Tabular Model endpoint, then you will have the option to write a Default formula or an “SSAS Tabular” formula.
You would expect that, when having just the SSAS Tabular Model endpoint, it doesn’t matter if you used the default formula or the SSAS Tabular-specific formula. However, in some versions of TimeXtender, using the default formula doesn’t give the expected results, or doesn’t give you all the functionality that you need.
Therefore, as a general rule, it is better to use the SSAS Tabular-specific formula rather than the default one.
But be aware, when you open the “Add Custom Measure” window, the default formula is selected by default. So, first change to the “SSAS Tabular” endpoint in the left pane, and only then start to write the formula.
No equal sign
In the script/formula, don’t start with the measure name or equal sign, start immediately with the formula
Use of Parameters
In TimeXtender, it is always better to use parameters wherever you can. It allows for Data Lineage and Impact analysis. It also allows you to change underlying fields without breaking the formula of the depending formula, only a redeploy will be needed.
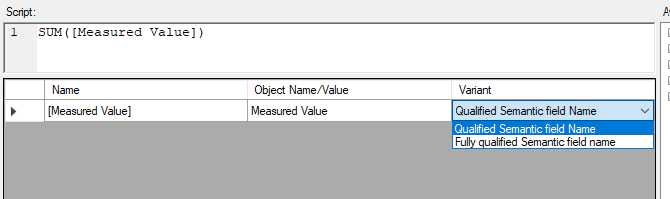
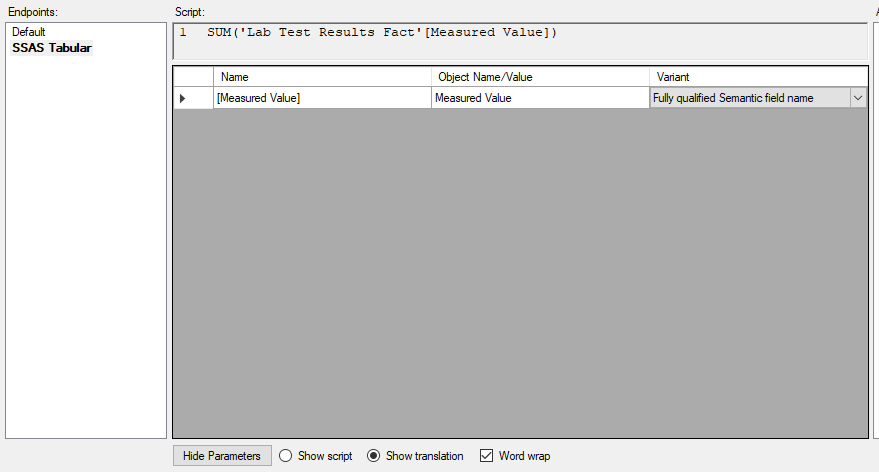
When using parameters when writing a DAX formula for a custom measure, special attention needs to be given to the “Variant” field.
By default, it will be set to “Qualified Semantic field Name”. But this usually results in a non-working formula.
Therefore, change to “Fully qualified Semantic field name”.
It is always good practice to check the result by clicking on the “Show translation” option, to see how TimeXtender will translate the parameterized code into the code that will actually be used.
This translated formula is the formula that you could test upfront in a DAX editor tool, to check for possible errors.
You can see in this example that setting the Variant to “Fully qualified Semantic field name” ensures that the field name is preceded by the table name.
Apart from referencing a semantic field, you can also use parameters to reference a semantic table or another measure.
Note that in the case of a measure, the “Variant” can only be set to “Semantic measure”, so no need here to change the variant.
(Note that, unlike a semantic field name, a measure name is unique for the entire model, so there is in fact no need to precede the measure name with the table name.)
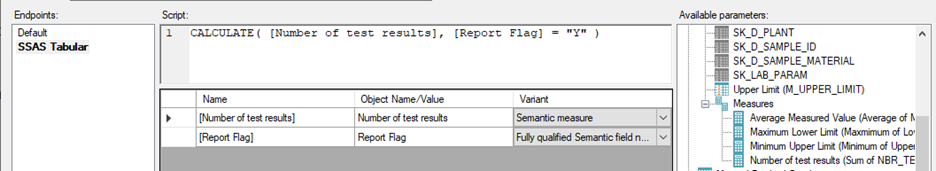
Note that the measures only appear in the “Available parameters” pane when you have selected “SSAS Tabular” as endpoint in the left pane.
So, if you don’t see any measures appearing, please check if you have changed from “Default” to “SSAS Tabular” in the left pane.
Use of double quotes for string constants and curly brackets for sets
When using string constants in your formula, make sure to use double quotes.
E.g. :
CALCULATE( [number of test results]
         , [Report Flag] = “Y”)
When defining a set, e.g. in combination with the IN operator, make sure to use curly brackets.
E.g. :
CALCULATE( [number of test results]
         , [Product Status ID] in {4, 6, 7, 9})
Be aware of your SSAS version
Some DAX functions or operators only exist in more recent versions of SSAS.
E.g. if you use an older version of SSAS Tabular that doesn’t support the IN operator yet, then you won’t be able to use the above formula.
Instead, you will need to use the && operator.
CALCULATE( [number of test results]
         ,    [Product Status ID] = 4
           || [Product Status ID] = 6
           || [Product Status ID] = 7
           || [Product Status ID] = 9  )
Note that the || operator means OR. There is also an OR function, but this function only takes two arguments. So rather than nesting 4 OR functions, it is more elegant to use the || operator.
Similarly, there is also a && operator that can be used instead of the AND function, which also only takes two arguments.
Apply security
In some cases, security needs to be applied.
Security can be applied on two levels:
- Access to the model: Which users have the right to make queries/reports on this model
- Row level security: Which subset of the data is a user allowed to see
Access to the model
- Create a role and assign users to the role
- Map the role to the endpoint, in this case your SSAS Tabular Endpoint.
Set up Row Level Security
There is the choice between dynamic or manual set-up.
It is advised to use a dynamic set-up, so that changes to the security can be maintained outside of TimeXtender, e.g. in a master data table, a SharePoint list, or an excel spreadsheet, …
In that case, make sure to first upload the security information into a table inside TimeXtender.
Then, the row level security can be set up:
- Right-click the field in the semantic model that you want to base your row-level security on, and choose “Add Row-level Security Setup”.
Set the type to “Dynamic”, then select the table or view that holds the security information.
Select the field within that table/view that holds the “Values”, e.g. the country codes if you are applying security on country.
Select the field within that table/view that holds the member names, i.e. the user names/logins.
If applicable, select the value that has the meaning of “All”. - Map the security set-up to the role: right-click the security set-up, select “roles”, and then click on the wanted role. A checkmark will appear in front of the role.
Multi-user development
It is possible to work with different developers on one TimeXtender project.
However, it is not wise to work with different developers on the same objects inside the project. This is logical, because during a deploy or a save operation, only the changes of that developer will be saved and deployed, possibly overwriting the changes of the previous developer.
When working in the data warehouse layer, every table or view is a different object, so it is possible to divide the work and prevent interfering with each other.
But when working on the SSAS Tabular Model, the entire model is one object, which is also deployed as one unit into the SSAS database.
Therefore, it is important not to work on the same model with multiple users at the same time.
The best thing is to agree on a sort of soft locking process through communication:
- The first user informs everyone that he will start making changes to the model.
(Before doing that, he checks if no one else had already communicated from their side)
After this communication, no other user should make changes to the model. - The first user makes his changes, deploys, and tests.
- He communicates that he has finished making the changes
- Now, another user can plan to make his changes.
First, he needs to reload the project, so that he sees the latest version of the project, including the changes made by the first user. - He can now, in turn, communicate that he will make changes, thus informing the other users that they should wait with their changes.
Note that TimeXtender provides a tool for this soft locking process, called work items. But this can only be used for tables and views, not for a semantic model.
Therefore, users should agree on communication methods outside TimeXtender, like email, a Teams chat, and a shared spreadsheet, …


