(written by Justin Zwijns - element61 Trainee in 2022)

What are “Power BI Goals”?
Power BI Goals is a simple way to track KPIs against specified targets. It allows a business user to centralise metrics and important business objectives to track their progress. It is also an easy-to-use and visually appealing tool while allowing collaboration and engagement on the platform.
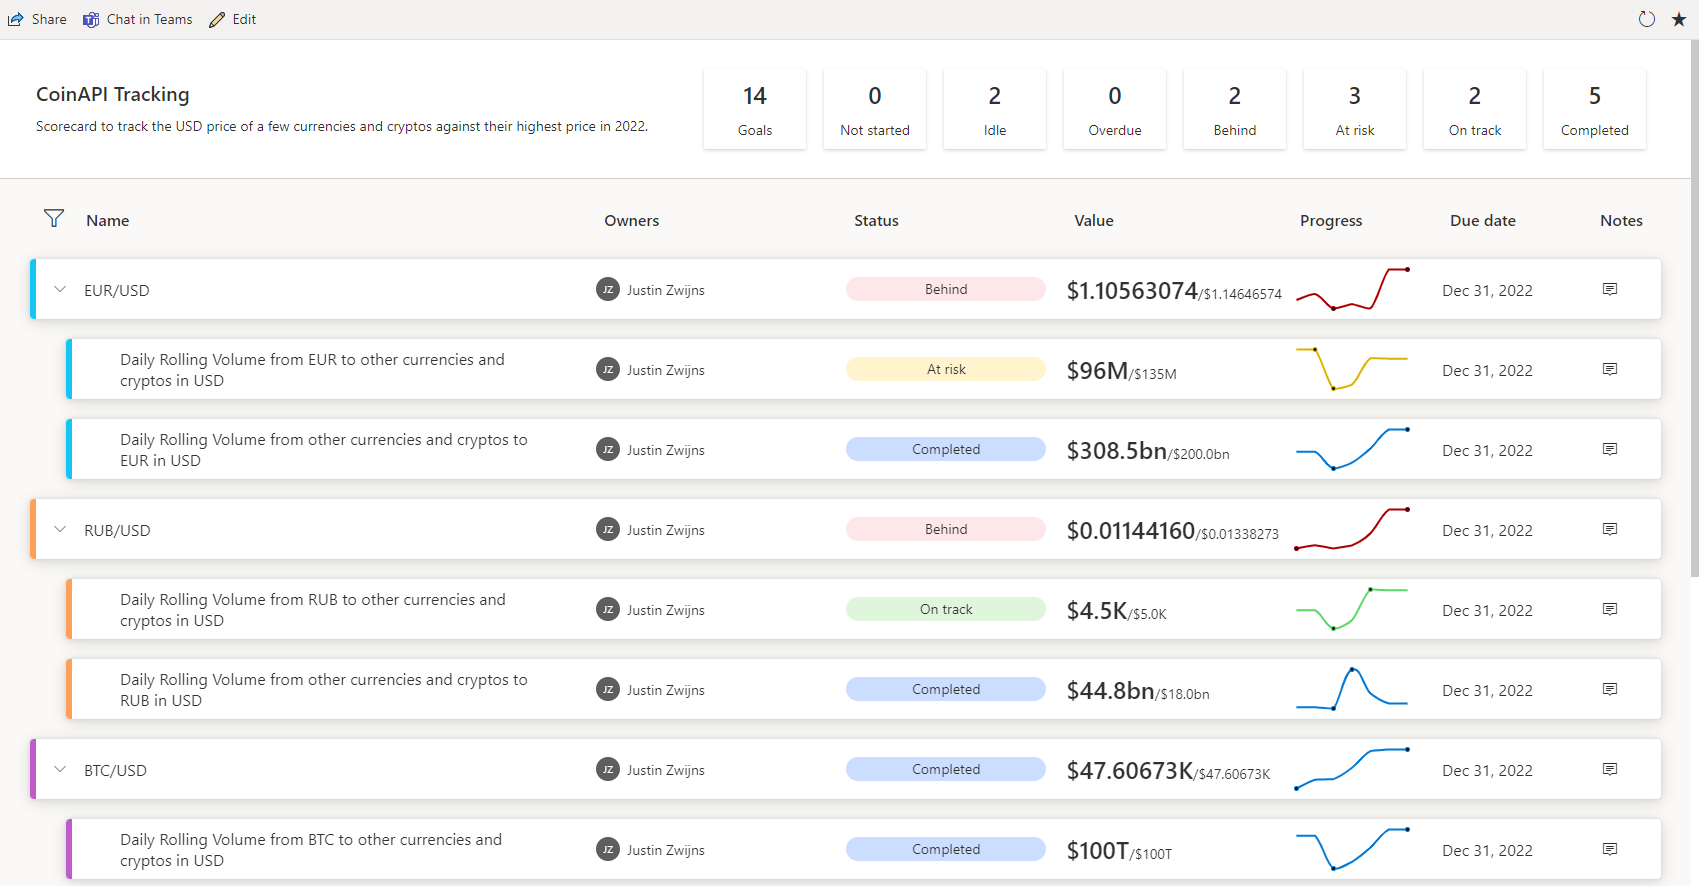
With Power BI Goals, you can track progress of any data that changes over a certain period of time. Data updates can be done manually by the business user or set automatically via a scheduled dataset refresh. Goals are made in a “scorecard”, which is a collection of goals and can currently be set-up in the Power BI service. A preview feature is also available to set it up in the Power BI desktop app. Note that Power BI Goals is a Pro feature and has been in public preview since May 2021. Since its launch, Power BI Goals has undergone several updates. Below an example of a scorecard.
Why use Goals?
As a business user, you might want to have an accessible and easy to understand tool to track KPIs and push updates to other users. Here, the Power BI Goals come into play.
Power BI Goals is a user-friendly feature made for business users in day-to-day use. In our opinion, the functionalities and buttons are straightforward, which makes it easy to set up. We were able to set up Power BI Goals in less than 2 hours in our own Power BI environment. Goals can be customised to meet an organisation’s specific needs with status rules and using subgoals. Since March 2022, colours and terminology can be customized as well.
With Power BI Goals, you encourage more collaboration with your team and colleagues. Using notes, business teams can explain a certain change of the tracked value and, as such, start a discussion. The discussions can take place in the notes or in the next meeting and will boost alignment in a team or organisation.
Using Goals, organisations can ensure that employees feel more engaged and involved towards shared objectives. Instead of opening one or more published Power BI reports and passively consuming them, goals can be stored in one place so that users can actively take part in the process of keeping goals up-to-date and take on more accountability for the value they bring to the organisation.
Key functionalities
In this section, we highlight the most important functionalities that Power BI Goals offers. The following items will be discussed: adding and updating values, statuses, check-ins, subgoals, tracking cycles and permissions. This is what a goal looks like before any input:

Adding and updating values
The purpose of a goal is to compare the current value to a target value. There are two ways of adding those two values to the goal:
- Add a value manually by typing it in the box.
- Connect to data from a published Power BI report. Establishing a connection with that report creates the opportunity to connect with very specific values of the visuals. For a visual with a drill-down and/or a drill-through option, the desired level and value can be chosen.
Both methods can be used in one goal, for example a current value connected to a report and a manual target value. It’s also possible to use a goal with only a current value when there isn’t a target value.
The current value selection also supports time series data. Instead of starting to track from today on, goals will collect the historical data too. One functionality we miss here is an autofill for the start date when selecting time series data. For example, when the first data point from the time series is March 01/03/2022, Power BI should automatically set that date as the start date.
To update a manually entered current value, a new check-in must be created (more about this functionality later). When using a manual target value, change it by going into edit mode, which can be found at the top of the page. A connected value is updated automatically when the dataset from the connected report refreshes. Connected data can't be overridden by a manual entry.
Statuses
When tracking a KPI, it’s important to know how good or bad the current value is. This is what the status of a goal is about. A status can be changed manually or can change automatically based on status rules. Changing a manual status can be done with a check-in. Status rules are used to change the status automatically based on how low or high a current value is. A status rule is similar to an if-statement and can contain more than one condition. Unfortunately, status rules can’t be duplicated to speed up the process of creating similar rules.
A status rule can be based on three different things:
- Value
- Date
- Value change
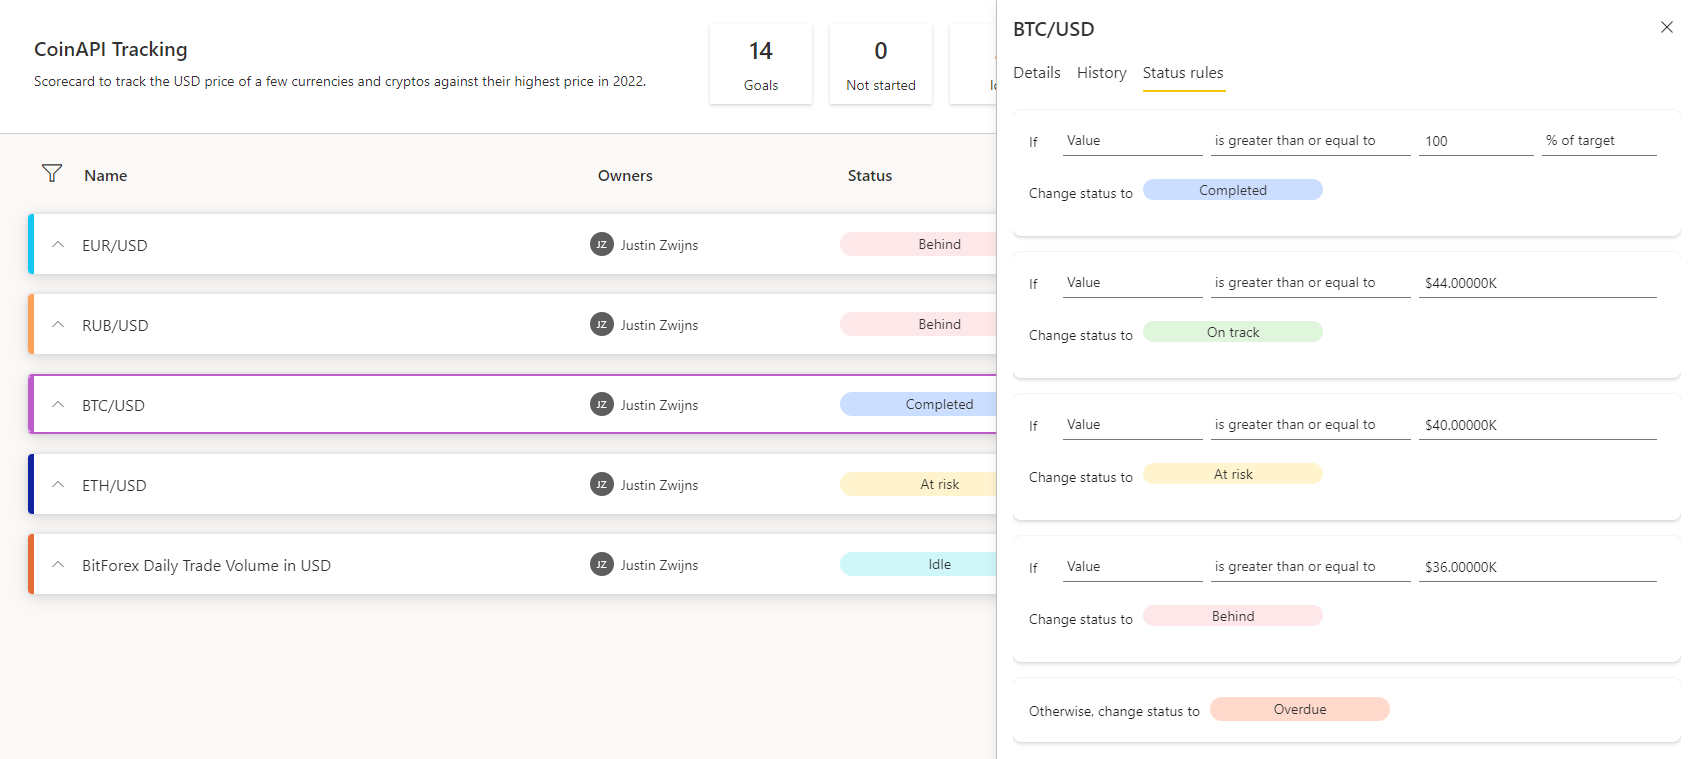
The order of these status rules is important. The rule at the top is the most important rule, the rule at the bottom the least important one. Below an example that illustrates this.
The goal BTC/USD has reached its target value. Because the status rule for completed is at the top in the first screenshot, Power BI marks the goal as complete. But watch what happens when we move the rule from behind to the top in the second screenshot. Because that rule is true, the goal is marked as behind, while the goal still has the same value as in the first screenshot.

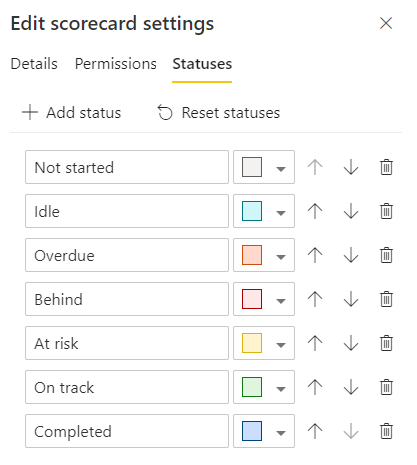
As a business user you would like to adapt the terminology used for the statuses, so that they suit the terminology of the organisation. As previously mentioned, this is possible thanks to the update of March 2022. The update included a new option to manage statuses where a user can change the names of existing statuses and add new ones too. For the different statuses, there are a limited number of colours to choose from.
Check-in
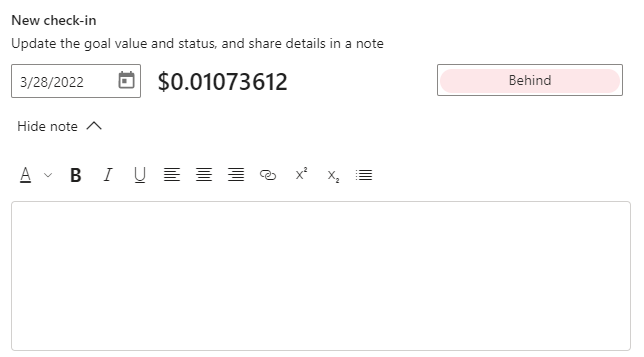
A check-in can contain four things: a value, status, date and a note. Regarding the first two, it is important to keep in mind that the value isn’t adjustable if it is connected, nor is the status when it’s controlled by the automated status rules. Additionally, it’s possible to indicate the day for the check-in and add a note. A note can be used to, for example, explain a specific change from the current value. After adding a check-in to a goal, more than one note can be added to that check-in.
Subgoals
Not every KPI consists of one metric, and sometimes it is necessary to have multiple subgoals. With Power BI Goals, there are up to four levels of subgoals. The order and level of a goal and subgoal are easily changed by dragging the goal to the right place. Just like statuses, subgoals and goals can’t be duplicated.
It is important to note that the highest level of a goal does not aggregate the subgoals. A manual data entry or data connection for a main goal is necessary.
Tracking cycle
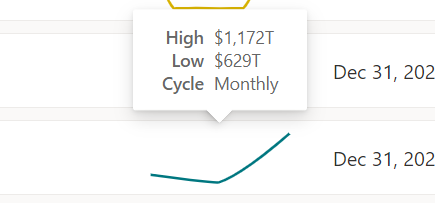
The visual from a goal is a great way to immediately see what the progress looks like. The tracking cycle setting of Power BI Goals fulfils the need to see the visual update on a monthly basis, while the data is refreshed daily. This setting offers a daily (default), weekly, monthly, quarterly or yearly tracking cycle. It is important to point out that the visual shows the seven last available data points for the chosen cycle. This means that when using for example monthly, the visual shows data from the last day of each of the past seven months.
![]()
Permissions
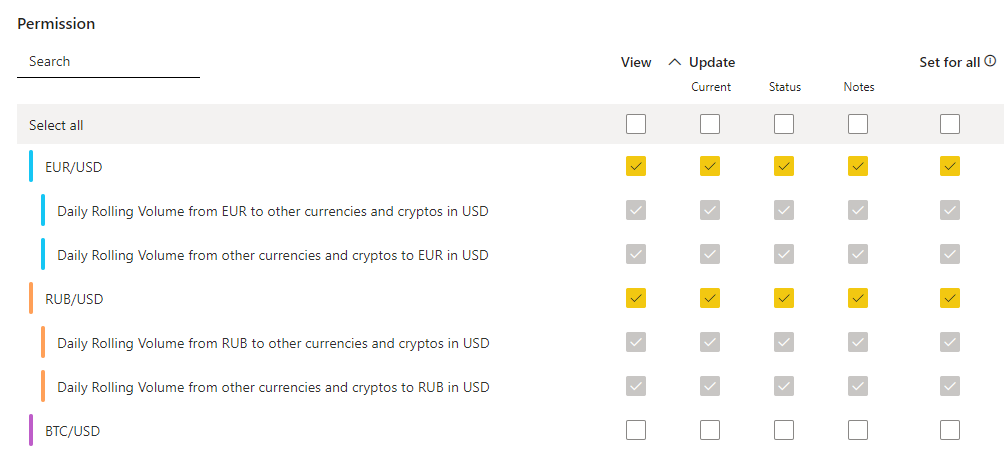
Security and permissions are crucial within these tools. While Power BI Goals dont support row-level security (RLS) yet, it does have a goal-level permissions. They are managed with roles, which hold the specific permissions to view and update goals.
Extra steps
In this chapter, we point out possibilities and extra steps to add after setting up goals in the scorecard. They are here to take Power BI Goals to the next level.
MS Teams
Microsoft has a wide range of apps and has integrated many of them in Microsoft Teams. Power BI is one of those apps. Thanks to that integration, scorecards can be added to different charts and/or channels to view and edit them from there.
Power Automate
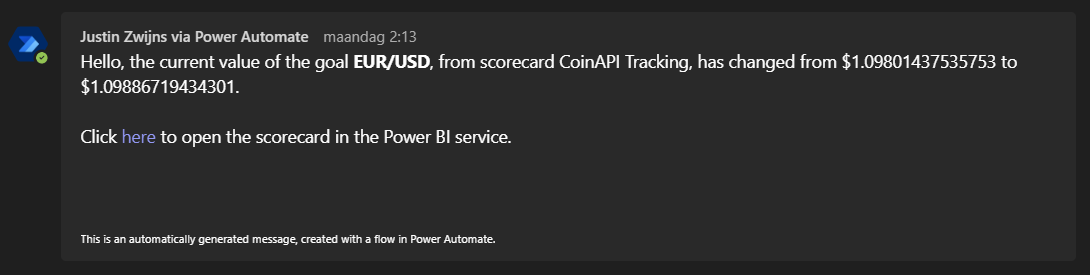
Power Automate offers the ability to stay up to date with the latest changes of goals, like value and status changes and new or edited check-ins. When creating a flow, dynamic fields can be added, like the previous current value and the new current value. A flow consists of the series of tasks that will be automated. In the example below, we have used the dynamic fields to generate and send the following message in a Microsoft Teams channel.
Report on top of Goals
All the data that ends up in the scorecard is automatically collected in a new dataset. With that data set, a report can be created on top of the scorecard.
Scorecard visual
The Power BI desktop app has a preview feature for a scorecard visual. It is enabled by going into the preview feature options. Then there are two options. The first one is to simply connect to a scorecard created in the Power BI service. The second option is to create a new scorecard in the app instead of regarding the service.
Creating a scorecard in the Power BI app works exactly the same as creating one in the service apart from one significant difference. The app provides a lot of formatting options for the scorecard in general and the goals, like hiding (sub)titles, headers and changing colours and backgrounds whereas the service doesn’t.
There are two disadvantages of the scorecard visual:
- The formatting options don’t synchronise to the scorecard in the Power BI service
- The visual lacks performance compared to goals in the service, it doesn’t work as smoothly
Pros and cons
|
+ Easy and quick setup |
- No autofill for start date when selecting timeseries data |
|
+ Encourages collaboration and engagement |
- No option to duplicate a goal or status rule |
|
+ Specific value selection |
- No RLS |
|
+ Custom statuses |
|
|
+ Subgoals |
|
|
+ Different tracking cycles |
|
|
+ MS Teams integration |
|
|
+ Automation options with Power Automate |
What’s to come?
- Goals rollups: rollups will solve the problem of not having any aggregation from a subgoal to the main goal. It will offer the possibility to indicate how the main goals should be calculated based on their subgoals.
- Cascading of goals: this planned feature will make it much easier to roll out goals to various levels of a data model hierarchy, such as a geographical or product one.
- RLS: according to Microsoft documentation, row-level security isn’t supported yet. This should mean that Microsoft has this on their to-do list, but it hasn’t appeared on any release wave yet.
Conclusion
We are excited about Goals in the Power BI service. We recommend using it because with the help of this user-friendly feature KPIs can be consolidated, centralised and managed. Sharing the scorecard will boost alignment throughout a team or organisation. It also offers new ways to collaborate through notes and Microsoft Teams. In addition, the latest update that introduced custom status rules has a great added value. Finally, we are looking forward to seeing what the future updates bring for Power BI Goals.


