Mobile business intelligence has been part of everyone’s business intelligence roadmaps for quite some time now. However, until recently, Microsoft didn’t have a solid offering in its SQL Server BI stack that could tackle the specific needs of displaying reports and dashboards on mobile devices. With SQL Server 2016, Microsoft aims to change all this.
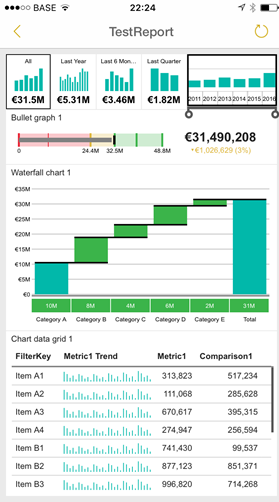 The first step towards offering a complete mobile BI solution was the acquisition of DataZen, a company specialized in building responsive mobile dashboards on top of Analysis Services, the OLAP solution of Microsoft. In the initial phase, enterprise customers could use the DataZen technology – which required the installation of a separate server – for free. With the release of SQL Server 2016, Microsoft incorporated the DataZen technology into the Reporting Services (SSRS) product, where the technology has been rebranded as “mobile reports”. This means that if you have SSRS 2016 installed on your servers, you now have access to a full mobile BI solution.
This article aims to give an overview of the capabilities of the mobile reports. A deep technical explanation on how to create such reports is out of scope. A comparison will be drawn between the abilities of the mobile reports and Power BI at the end of the article.
Mobile Reports in SSRS 2016
The product solution Microsoft acquired from DataZen actually consists of two parts:
- Key Performance Indicators (or KPIs). These are useful little visualizations that give a quick glance on how a specific measure is doing. KPIs are displayed on the Reporting Services portal.
- Mobile Reports. These are slightly interactive dashboards which are also stored on the Reporting Services portal. The most important advantage is that they have a responsive design: depending on the screen size it’s possible to show a different dashboard layout.
Let’s take a closer look at those two components.
Key Performance Indicators
KPIs are small visualizations on the Reporting Services portal that give you a quick insight into a certain measure.
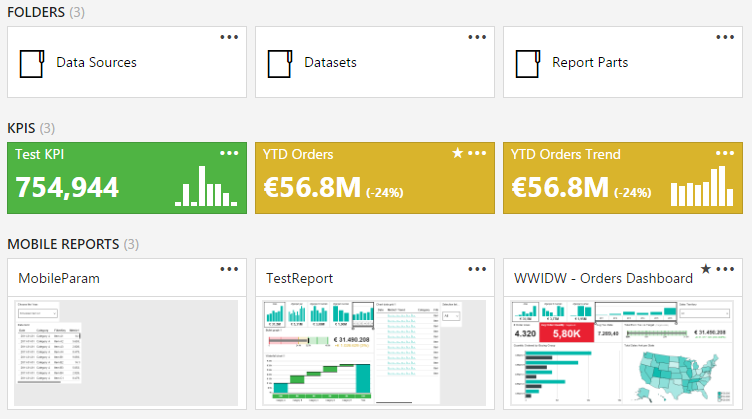
In the screenshot above you can see three distinct KPIs. Depending on the state, a color is assigned to the visualization. There are three possible states:
- Good – green
- Neutral – orange
- Bad – red
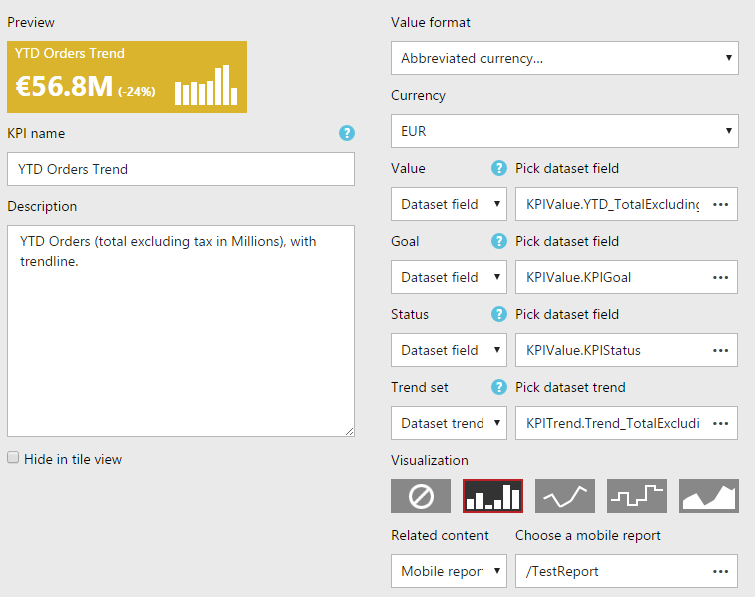
Configuring a KPI is straightforward. There are three important values to configure: the value (which is the current value of the KPI), the Goal (for example a certain budget value) and a status. The status needs to correspond with the values -1 (bad), 0 (neutral) and 1 (good). Those three values can be fetched from one or more shared data sets. Remember that only a single value is needed, so if the shared dataset has a result set with multiple rows, you’ll need to aggregate them.
Finally, you can also a sign a trend to a KPI. Trends can be important to judge if any progress is being made for the KPI. For example, suppose sales have reached €990,000. The yearly goal is 1 million euro. At first sight, everyone seems to be fine. Now suppose there hasn’t been a single sale for the last three months. In that case the status of the KPI is good, but the trend is a flat line which is an important warning signal.
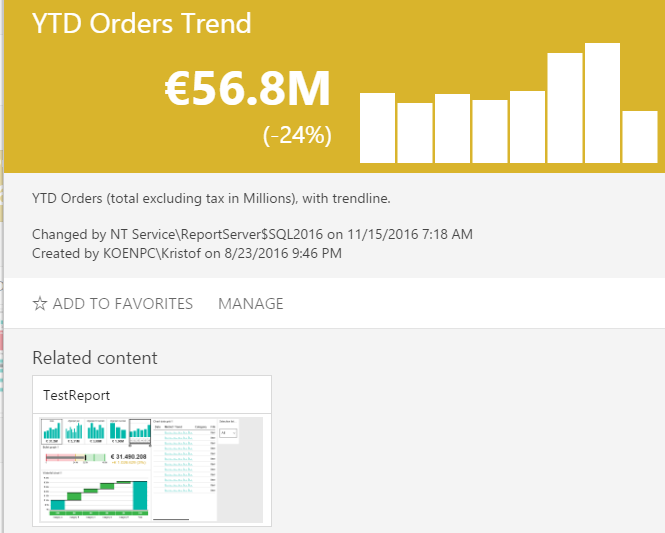
The trend line itself can take multiple formats. The bar charts or the line graph lend themselves to most scenarios. Clicking on a KPI in the portal will give you a more detailed view:
Mobile Reports
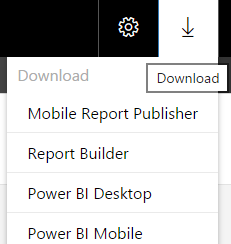
Mobile Reports are an entirely new part of Reporting Services. In order to create such an interactive dashboard, you need the Mobile Report Publisher. You can find all the software you need in the SSRS portal (see picture)
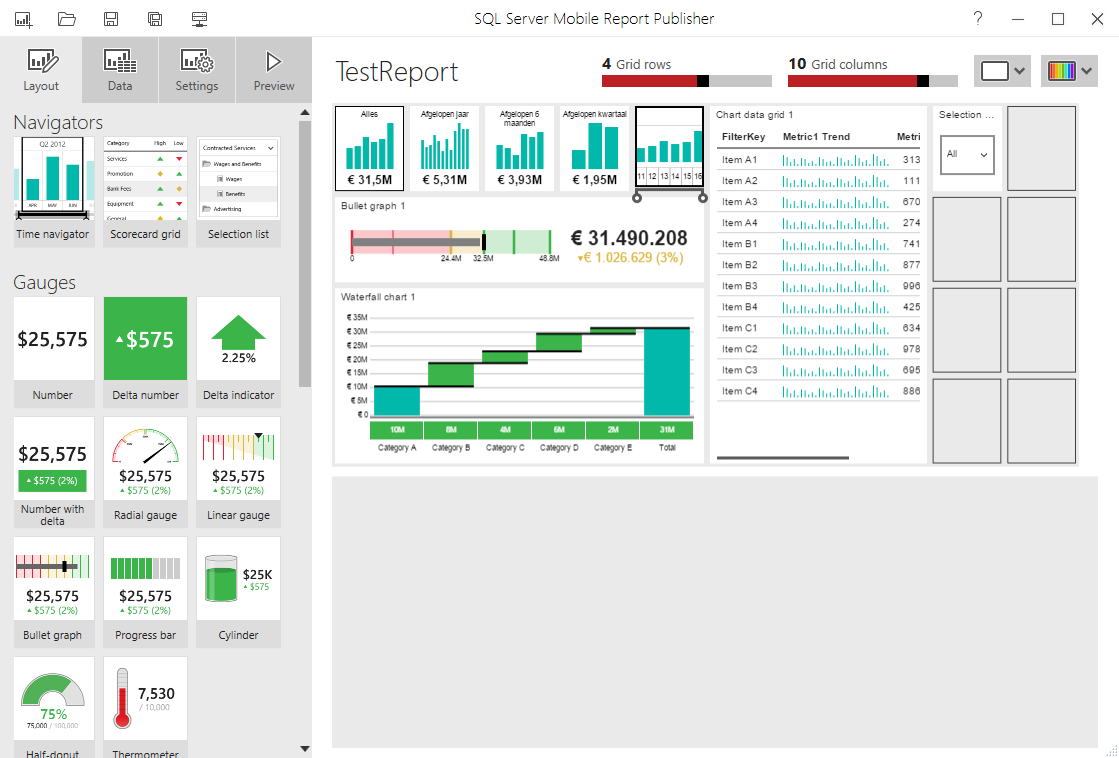
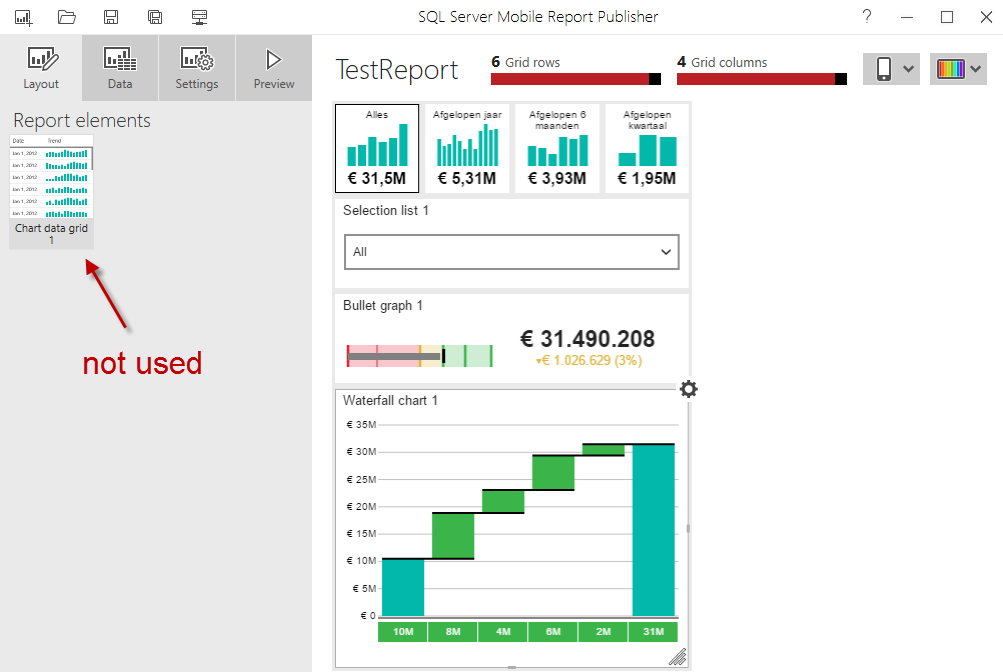
The Publisher has the following interface:
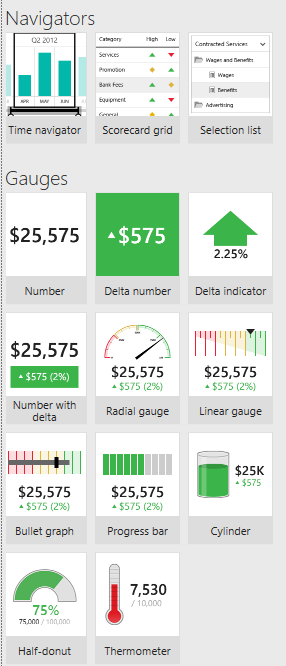
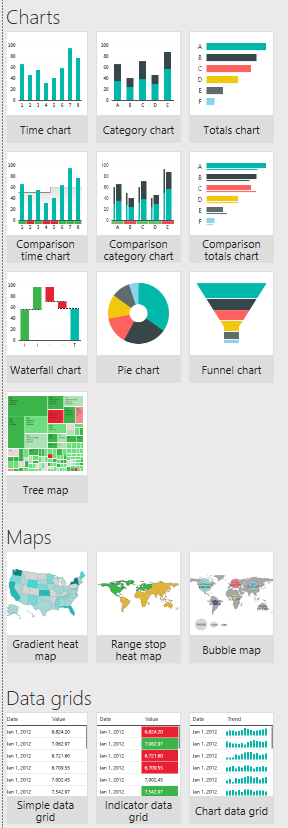
The main tab is the Layout. Here you decide of how many grid rows and columns the dashboard will consist of. At the left you have all of the available report objects, which you can drag into the grid. There are navigators, you can compare them with slicers and prompts, a whole range of gauges, a couple of charts, a few maps and some data grids. Data grids are tables; in which you can add some simple visualizations if you’d like. You can see all of the report objects here side by side:
Important to know is that with the Mobile Report Publisher, you have two methods of designing your dashboard:
- Design first, data later. You can simply start by dragging report object onto the canvas. The Publisher will add sample data sets with random data to support these visualizations. The dashboard is interactive from the start. This method is especially useful for proof of concepts and for brainstorming. You can add the real data sets later on and connect them with the report objects.
- Data first, design later. Here you add the data sets first and you connect them immediately with the report objects when you add those to the canvas. This way of working is what we see in most other report editors, like Report Builder and Power BI Desktop.
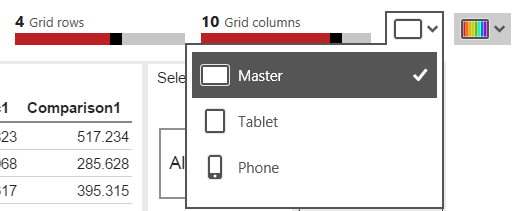
Another important aspect of the layout tab is the ability to switch from grid layout depending on the screen size. You can choose the screen size in the upper right corner.
When you switch to Phone, you’ll notice the grid is noticeably smaller. Here you can add report objects which you already added to the Master canvas. But you can either make them smaller, or you can leave some out altogether in order to compensate for the smaller screen size.
In the Data tab you manage your data sets.
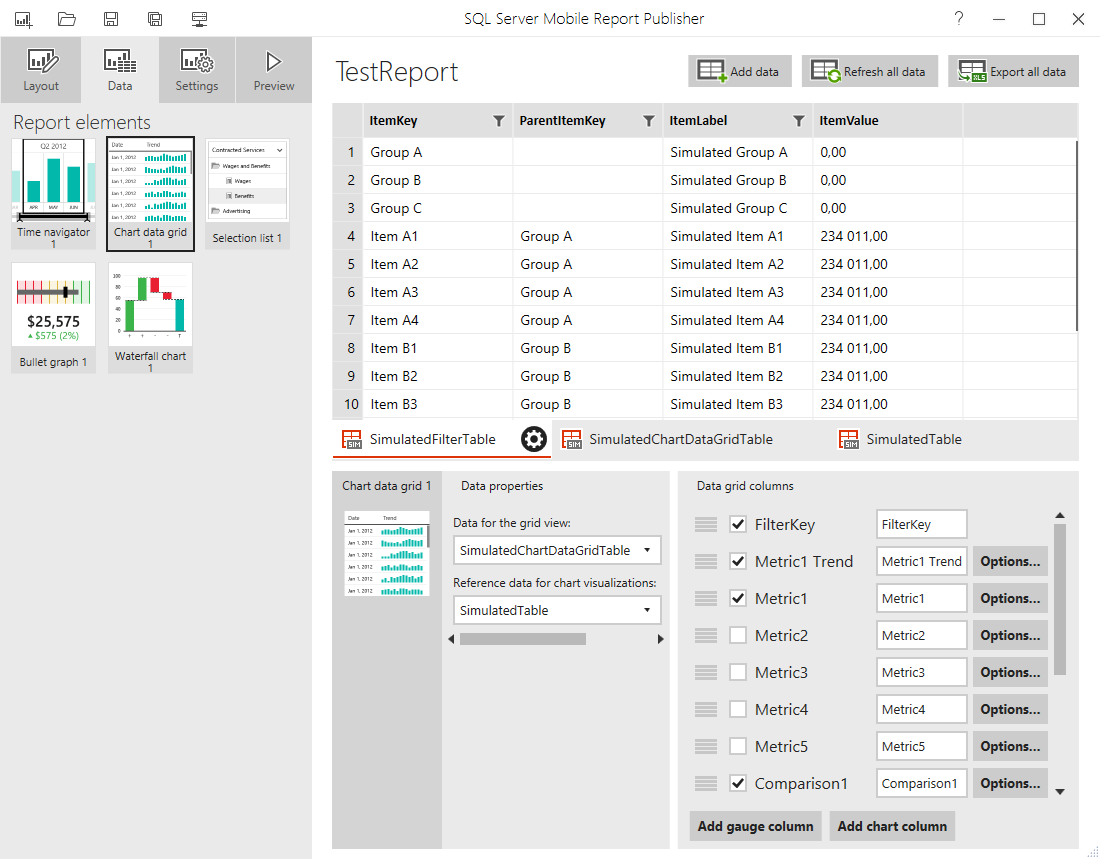
You can add multiple data sets, which are either Excel files or Reporting Services data sets. For a given data set, you can configure parameters if needed. When you have added the data, you need to connect each report element to the columns of the data set. In the previous screenshot, you can see how the data grid report element is connected to the data set. For each column of the data set, you need to choose if it is included in the grid or not. You can also configure if the report element is filtered by one of the navigators and if applicable you can also set the type of aggregation.
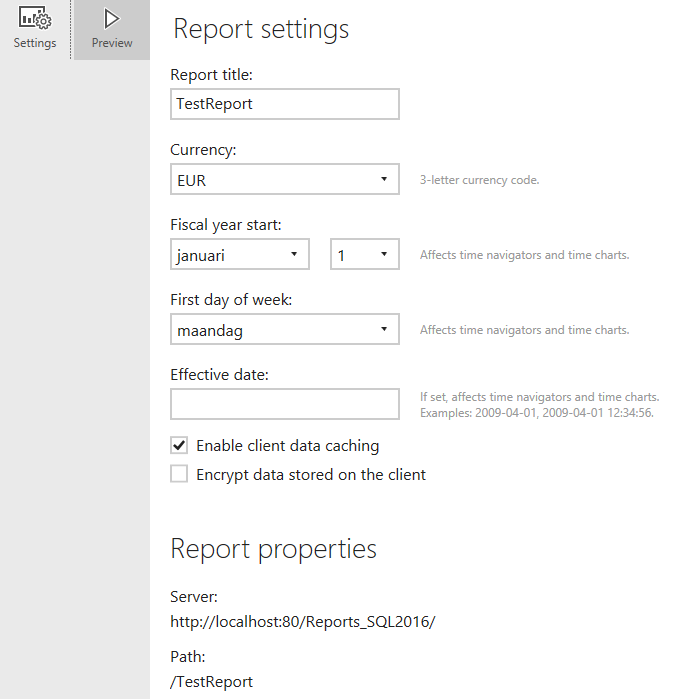
In the Settings tab you can set some various report properties, such as the currency and some time related properties like the first day of the week.
The final tab is Preview, which will render the dashboard in the canvas size you have currently chosen in the Layout tab.
When finished, you can deploy the mobile report to the Reporting Services portal, where you can set the security just like any other object in the portal.
Mobile Business Intelligence
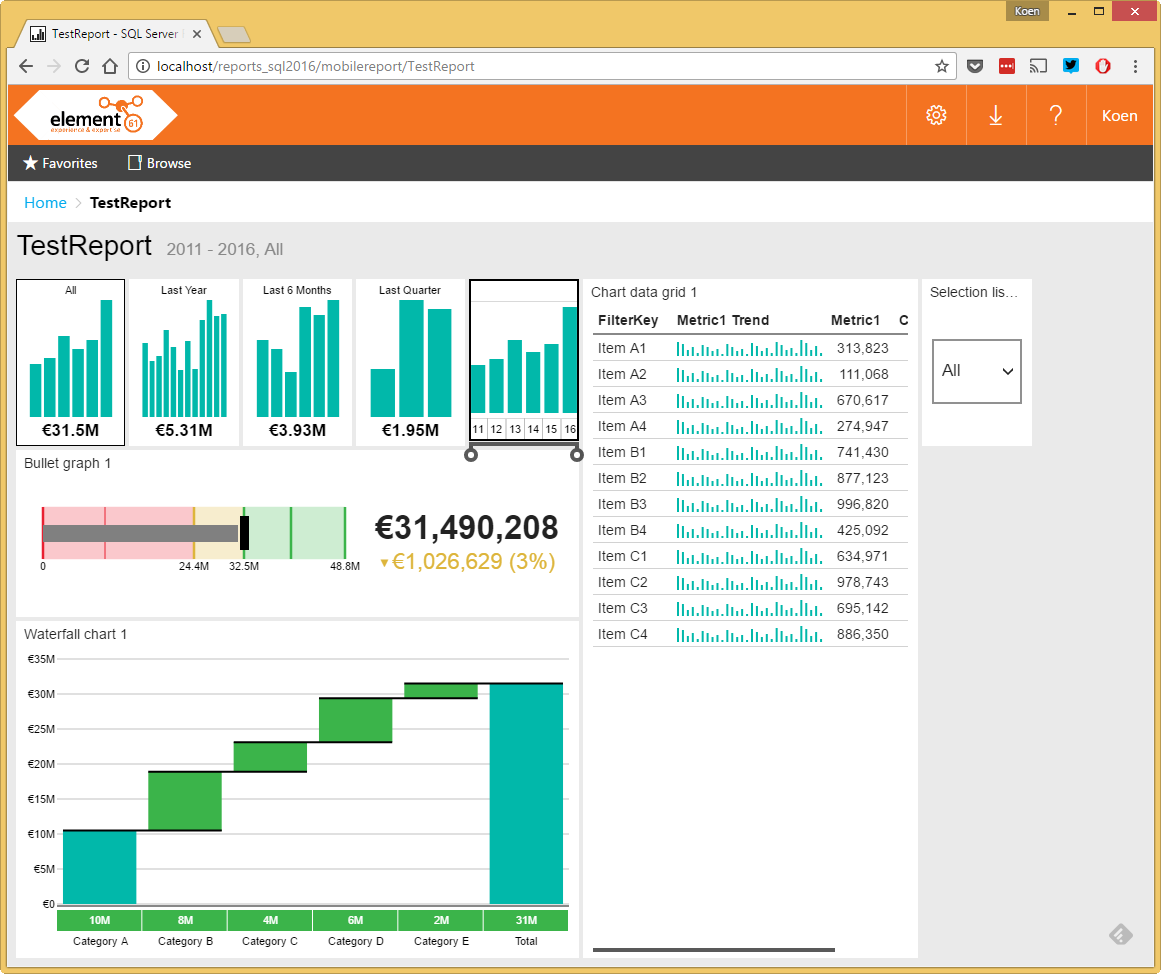
Now that we have taken a quick glance at how we can create KPIs and Mobile Reports, let’s find out where exactly the “Mobile” comes into place. You can browse to the Reporting Services portal using any browser you like. When you open up a mobile report, it will render in the browser depending on the screen size.
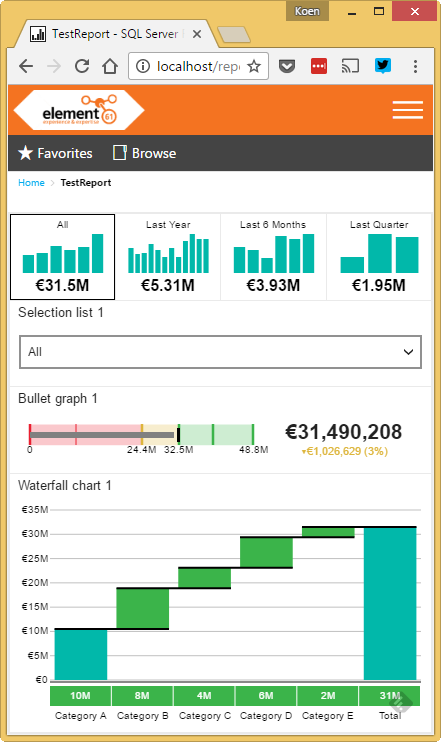
If I now reduce the size of the browser, the mobile report will adapt accordingly.
But that’s not all. Power BI comes along with a free native app for iOS, Android and Windows Phone. With this Power BI app, you can also connect to your own Reporting Services instance and browse your KPIs and mobile reports. An important feature here is that you can still interact with your dashboards even if you don’t have connectivity.
Mobile Reports vs Power BI
With the introduction of Mobile Reports, you now have an easy to use mobile business intelligence solution in your hands. However, Microsoft offers an alternative solution as well: Power BI. Power BI is a cloud solution that offers many interesting features and capabilities (read more about it in the insight Microsoft Power BI: an overview). Power BI reports can be developed locally in the free tool Power BI Desktop and then published to the cloud environment.
So the question is: which product should you choose? At first sight, Power BI seems the obvious choice. It has much more features than the SSRS Mobile Reports. To name a few:
- The ability to add custom visualizations. You can either write your own or download open source visuals from the Power BI gallery.
- The extension of Power BI with the statistical language R. You can create advanced visualizations with R or you can use R code for advanced analytics: forecasting, data cleaning, machine learning and so on.
- Power BI supports many more sources and has content providers which build dashboards for you with just a few clicks. For example, you can use the Google Analytics content provider to build a dashboard and report solution on your Google Analytics account. All it takes is logging in.
- Power BI is very scalable due to its in-memory columnstore storage.
Mobile Reports have the ability to develop a layout adapted to various screen sizes, but Power BI Desktop has added this feature as well in one of its latest releases. One of the only features in Mobile Reports that is at the time of writing not present in Power BI is the ability to interact with offline reports.
Let’s assume that for normal reports, Reporting Services itself is used. These are now rebranded as “paginated” reports. Those are the kinds of reports you’d want to print out on a piece of paper and give them to your manager. Good examples are profit/loss reports and balance sheets. For your mobile business intelligence, you have to choose between mobile reports and Power BI. Currently, if your company doesn’t want to work with a cloud product, you have no other choice than to use the SSRS mobile reports. If the cloud is an option, Power BI is a very good choice.
However, Microsoft will soon enable to host Power BI Desktop reports on premises, using your Reporting Services instance. In such a scenario, the question becomes: why use the mobile reports at all? The answer is simple. In Power BI – the cloud environment – you have reports (build in Power BI Desktop) and dashboards (build in the browser). A dashboard is a collection of tiles, where a tile is a report object linked from an actual report. In an on premises environment, the SSRS mobile report would be the replacement of those dashboards. In other words: the ideal scenario would be to use Power BI Desktop reports alongside the SSRS mobile reports. Each report type would support its own specific use case. In this scenario, you have a best-of-breed hybrid business intelligence solution.
The following table aims to give an overview of the main differences between the different reporting products of Microsoft:
| Paginated Reports | Mobile Reports | Power BI | Excel | |
|---|---|---|---|---|
| Created by | IT | IT | Users | Users |
| Interactivity | Limited. Required advanced knowledge | Limited interactivity | Supports dozens of different sources. Online and on premises | Interactive (pivot tables and charts) |
| Data sources | Mainly databases | Mainly databases | Supports dozens of different sources. Online and on premises | Typically Analysis Services |
| Coding required | Yes | Only for data set | Not for live models. Coding can be required for in-memory models. | No |
| Export options | Excel, PDF, Word, PowerPoint, HTML, CSV, XML, TIFF | CSV |
Conclusion
With the inclusion of the DataZen technology in Reporting Services 2016, Microsoft finally has an easy-to-use mobile business intelligence offering. The technology consists out of two parts: KPIs – which are visual indicators of an important measure – and mobile reports. With mobile reports, you can build attractive and interactive dashboards which are responsive to the screen size: if the screen size changes, the layout will adapt accordingly.
Microsoft also has the Power BI offering, but you shouldn’t choose between the two. You can rather use a mix of the two product offerings, choosing the reporting tool that best fits a certain scenario.
