Data preparation
Figure 1 - Add a new dataset in SAP Lumira
")
click to enlarge")
Figure 2 - Merge or Append two datasets
")
click to enlarge")
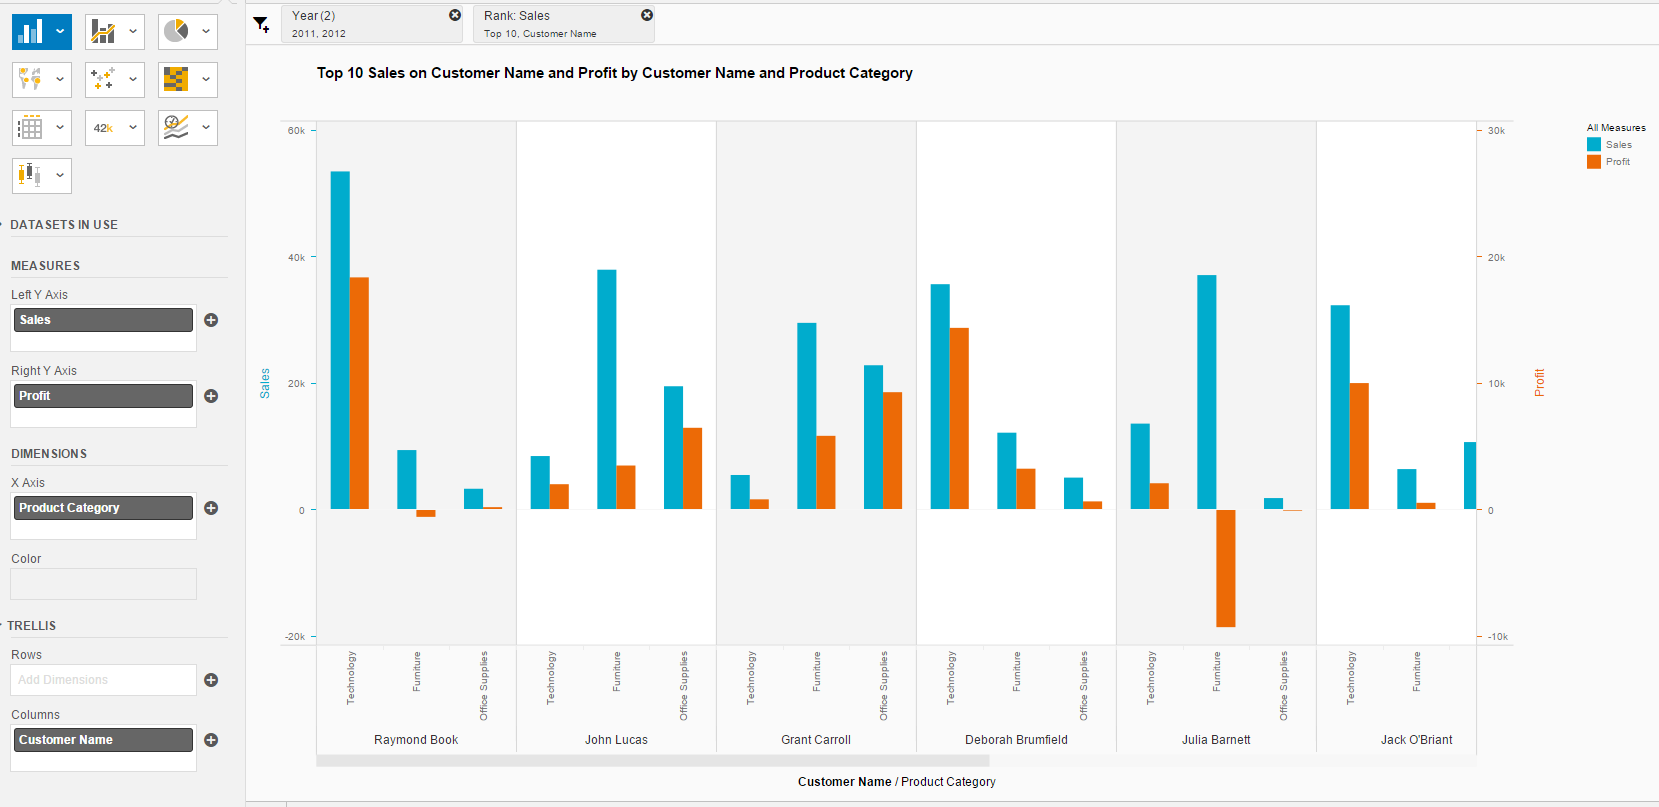
Visualization
Figure 3- Sample Sales by Month and Product Category
")
")
Figure 4 - Sample Ranking Top 10 Customers, Sales, Profit
")
click to enlarge") .
.
Figure 5- Sales by Region on the map
")
Compose Storyboards
Figure 6 - Sales by Customer Storyboard Combining Multiple Visualizations
")
")
Figure 7 - Sales & Profit Storyboard by Region and Province
")
") .
.Deployment Options
")
")
With custom extensions developers can build custom visualizations and connectors to tell unique data stories. There is were your storyboard can gain an edge case: e.g., a small addition which make a certain chart type just great for your story. Similarly, your insights might require a wealth of different sources and thus require you to build a special connector for you to report on it. In both cases, you may want to leverage SAP Web IDE to build your own custom charts and connectors.
At the same time a whole range of custom extensions is available for download in the Analytics Extensions Directory.
- Easy to use – no need for special IT skills, a person familiar with MS Office products can immediately start working with Lumira and prepare visualizations and storyboards
- Powerful presentation and data analysis tool connected in real time to multiple datasets. Upon data refresh and selections users can write their observations and findings in the same storyboard
- Integration with SAP HANA, BW, BW on HANA, and non-SAP sources
- Prompts and hierarchies integration for BW BEx queries and HANA views
- Cubes to go – capability to refresh datasets to a PC/tablet and work with them in an offline mode (e.g. on the plane)
- Geo maps integration via creating geographic hierarchies by names or Latitude/Longitude
- Ability to publish/share stories via a BI Platform
- Access to a range of open source custom Visualization and Data Access extensions
- Ability to download SAP Lumira stories on Mobile BI application for offline viewing
- Performance of SAP Lumira is better than BO Webi on large datasets whether on the desktop or in the BI Platform (See benchmark test results conducted by a SAP Partner)
- No capability yet to integrate input ready queries (planning and budgeting) – currently available in BO Design Studio
- No easy possibility for formatted multi page reports for printing
- Missing report to report interface (launching another report/dashboard based on user selections)
- On click actions (using selections from a chart and applying them elsewhere) – currently available in BO Design Studio
- No reports bursting/distribution capability – probably there is no need for this feature long term
- Currency conversions are not directly supported– currently available in BO Design Studio
- Lumira Desktop requires a client tool installation
- Lumira Server at the moment has a number of limitations vs. Lumira Desktop
- Integration with Hadoop is not mature yet
- There are still a number of issues and bugs to be fixed (See a list of issues in Lumira 1.31 compiled by SAP)
According to the SAP’s Roadmap SAP BO Lumira and BO Analysis for MS Office become key tools for data discovery, visualizations and analysis. Reports bursting and distribution together with printer friendly formatting are the only features that remain strong in BO Webi and Crystal Reports.
Figure 9 - Multiple Deployment Options (Source: SAP)
")
") .
.

