Fast and reliable access to your information is one of the key success factors for any Business Intelligence or Data Warehousing application. Within the technological architecture of SAP BW the multi-dimensional model of InfoCubes has a tremendous impact on performance. A good dimension design optimizes performance in three ways:
- Data load times
- Query runtime
- Database size
Introducing the problem: degenerative dimensions
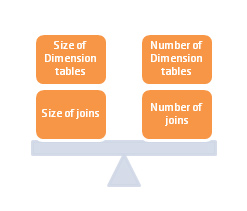
One of the most critical guidelines from SAP about multi-dimensional modeling in BW is: “The dimension / master (SID) tables should be relatively small with respect to the number of rows in comparison to the fact table (factor 1:10 / 20)”. When one dimension grows very large in relation to the fact table, the database optimizer finds it difficult to choose an efficient path to the data. This condition of a dimension having an exceptionally large record count relative to the fact table is known as a “degenerative dimension”.

Traditional modeling technique: trial and error
In order to come up with a good multi-dimensional model, traditional modeling papers say “know your data”. Although this is a very true statement, large data volumes make real-world experimentation impractical and time-consuming.
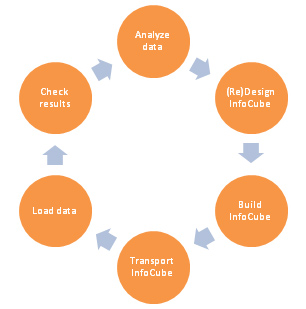
The traditional repetitive modeling process contains the following steps:
- Analyze the data
- Design the multi-dimensional model of an InfoCube
- Build the InfoCube
- Transport the InfoCube to an environment with a representative dataset (volume & diversity)
- Load data into the InfoCube
- Check the resulting multi-dimensional model (size of dimension and fact tables)
- If the result is not optimal, return to step one

The scientific approach to multi-dimensional modeling
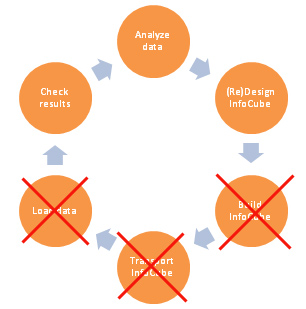
element61 has discovered a method to transform this art of multi-dimensional modeling into a science. We developed a SAP BSP application (portal based, fully integrated within BW) that eliminates 50% of the modeling (or remodeling of existing underperforming InfoCubes) processes and more than 50% of the modeling effort. The tool analyzes data in an existing data store object (DSO) or InfoCube and exposes all relationships between characteristics – good and bad – and how characteristics relate to the facts. This scientific approach immediately exposes whether or not 2 characteristics should be in the same dimension and signals potential issues with dimensional degeneration.
The tool also simulates 3 steps of the traditional InfoCube modeling process. Within the tool one can define the multi-dimensional model of the InfoCube to be built and calculate the exact expected sizes of dimension and fact tables thus eliminating the need to actually build “test” InfoCubes and load data. Results are displayed in an easy to analyze format with tables and graphs.

Results of this scientific approach?
- Reduction of more than 50% of the modeling effort
- Better data loading times (typically 20-50%)
- Increased user satisfaction through improved query performance (typically 20-50%)
- Smaller database size and less system load
The scientific approach to multi-dimensional modeling
As a seasoned data warehousing professional I have always wondered why data modeling is considered an art that requires a thorough understanding of the data and a lot of modeling experience. Why not analyze the data scientifically and make accurate predictions on data modeling outcomes?
When compared to a fact table, dimensions ideally have a small cardinality. How can we achieve this and simultaneously limit the number of dimensions?
Within SAP BW it is perfectly possible to analyze the data in a DataStore Object (DSO) or InfoCube with some basic SQL statements. Before initiating the multi-dimensional modeling process, wouldn't it be useful to know some basic scientific facts about the data?
- How many records does the dataset contain?
- How many distinct values does a characteristic have in the dataset?
- How many distinct combinations of 2 characteristics does the dataset contain?
This information is a critical input for the dimensional model design process. In SAP BW the number of dimensions is limited to 16, of which 3 are defined by SAP (Data Package, Time and Unit/Currency). Keeping in mind that one of the most critical guidelines from SAP about multi-dimensional modeling in BW is: “The dimension / master (SID) tables should be relatively small with respect to the number of rows in comparison to the fact table (factor 1:10 / 20)” and that there are only 13 dimensions left to be freely defined, it becomes very clear that the above information plays a crucial role in the definition of an optimal dimensional model where both size and number of dimensions are minimized.
If the ratio of distinct values of a characteristic to the total number of records is higher than 1:5 (question 2 : question 1), this characteristic is an excellent candidate for a line item dimension. This special type of dimension can only contain one characteristic. The SID table is then used directly as dimension table. This reduces the number of table joins. A typical example would be a document number which could have as many distinct values as the number of records in the dataset.
The answer to the 3rd question tells us whether or not 2 characteristics can be assigned to the same dimension. If there is a 1:N relation between 2 characteristics, they should be assigned to the same dimension, if there is a N:M relation between 2 characteristics, they could cause a dimension to degenerate when assigned to the same dimension.
If your dataset contains N distinct values of characteristic A and M distinct values of characteristic B, the possible range of distinct combinations of both characteristics in the dataset will be from the maximum of N and M to the product of N and M. If the actual distinct number of combinations of both characteristics is closer to the maximum of N and M, then there is a strong relation (1:N) between the characteristics and they should be assigned to the same dimension. If the actual distinct number of combinations of both characteristics is closer to the product of N and M, then there is a weak relation (N:M) between the characteristics and they should not be assigned to the same dimension.
If your dataset contains 100 distinct values of characteristic A and 1000 distinct values of characteristic B, the possible range of distinct combinations of both characteristics in the dataset will be from 1000 to 100000.
If the actual number of distinct combinations of both characteristics is close to 1000, then there is a good relation between both characteristics and they should be assigned to the same dimension. An example could be a sales dataset with 100 customer groups and 1000 customers. If every customer always belongs to one and the same customer group, then there will be only 1000 distinct combinations of customer and customer group in the dataset and both characteristics should be assigned to the same dimension.
The Dimensional Modeling Optimizer
The Dimensional Modeling Optimizer (DMO), an in-house developed BSP application, automates these and even more calculations. The tool analyzes a dataset in an existing DSO or InfoCube and generates recommendations for an optimal dimensional model.
Results of the scientific approach?
The advantages of an optimal dimensional model are huge. The DMO facilitates the scientific approach to dimensional modeling and typical results are:
- Reduction of more than 50% of the modeling effort
- Better data loading times (typically 20-50%)
- Increased user satisfaction through improved query performance (typically 20-50%)
- Smaller database size and less system load


